Category Archives: mechanics

Out of the valley of death into a hype cycle?

Fig 5 from Middleton et al with full captionThe capability to identify damage and track its propagation in structures is important in ensuring the safe operation of a wide variety of engineering infrastructure, including aircraft structures. A few years ago, I wrote about research my group was performing, in the INSTRUCTIVE project [see ‘INSTRUCTIVE final reckoning‘ on January 9th, 2019] with Airbus and Strain Solutions Limited, to deliver a new tool for monitoring the development of damage using thermoelastic stress analysis (TSA) [see ‘Counting photons to measure stress‘ on November 18th, 2015].  We collected images using a TSA system while a structural component was subject to cycles of load that caused damage to initiate and propagate during a fatigue test. The series of images were analysed using a technique based on optical flow to identify apparent movement between the images which was taken as indication of the development of damage [1]. We demonstrated that our technique could indicate the presence of a crack less than a millimetre in length and even identify cracks initiating under the heads of bolts using experiments performed in our laboratory [see ‘INSTRUCTIVE update‘ on October 4th, 2017].  However, this technique was susceptible to errors in the images when we tried to use low-cost sensors and to changes in the images caused by flight cycle loading with varying amplitude and frequency of loads.  Essentially, the optical flow approach could be fooled into identifying damage propagation when a sensor delivered a noisy image or the shape of the load cycle was changed.  We have now overcome this short-coming by replacing the optical flow approach with the orthogonal decomposition technique [see ‘Recognising strain‘ on October 28th, 2015] that we developed for comparing data fields from measurements and predictions in validation processes [see ‘Million to one‘ on November 21st, 2018] .  Each image is decomposed to a feature vector and differences between the feature vectors are indicative of damage development (see schematic in thumbnail from [2]).  The new technique, which we have named the differential feature vector method, is sufficiently robust that we have been able to use a sensor costing 1% of the price of a typical TSA system to identify and track cracks during cyclic loading.  The underpinning research was published in December 2020 by the Royal Society [2] and the technique is being implemented in full-scale ground-tests on aircraft structures as part of the DIMES project.  Once again, a piece of technology is emerging from the valley of death [see ‘Slowly crossing the valley of death‘ on January 27th, 2021] and, without wishing to initiate the hype cycle [see ‘Hype cycle‘ on September 23rd, 2015], I hope it will transform the use of thermal imaging for condition monitoring.

Logos of Clean Sky 2 and EUThe INSTRUCTIVE and DIMES projects have received funding from the Clean Sky 2 Joint Undertaking under the European Union’s Horizon 2020 research and innovation programme under grant agreements No. 685777 and No. 820951 respectively.

The opinions expressed in this blog post reflect only the author’s view and the Clean Sky 2 Joint Undertaking is not responsible for any use that may be made of the information it contains.

References

[1] Middleton CA, Gaio A, Greene RJ & Patterson EA, Towards automated tracking of initiation and propagation of cracks in Aluminium alloy coupons using thermoelastic stress analysis, J. Non-destructive Testing, 38:18, 2019.

[2] Middleton CA, Weihrauch M, Christian WJR, Greene RJ & Patterson EA, Detection and tracking of cracks based on thermoelastic stress analysis, R. Soc. Open Sci. 7:200823, 2020.

Going against the flow

Decorative photograph of a mountain riverLast week I wrote about research we have been carrying out over the last decade that is being applied to large scale structures in the aerospace industry (see ‘Slowly crossing the valley of death‘ on January 27th, 2021). I also work on very much smaller ‘structures’ that are only tens of nanometers in diameter, or about a billion times smaller than the test samples in last week’s post (see ‘Toxic nanoparticles?‘ on November 13th, 2013). The connection is the use of light to measure shape, deformation and motion; and then utilising the measurements to validate predictions from theoretical or computational models. About three years ago, we published research which demonstrated that the motion of very small particles (less than about 300 nanometres) at low concentrations (less than about a billion per millilitre) in a fluid was dominated by the molecules of the fluid rather than interactions between the particles (see Coglitore et al, 2017 and ‘Slow moving nanoparticles‘ on December 13th, 2017). This data confirmed results from earlier molecular dynamic simulations that contradicted predictions using the Stokes-Einstein equation, which was derived by Einstein in his PhD thesis for a ‘Stokes’ particle undergoing Brownian motion. The Stokes-Einstein equation works well for large particles but the physics of motion changes when the particles are very small and far apart so that Van der Waals forces and electrostatic forces play a dominant role, as we have shown in a more recent paper (see Giorgi et al, 2019).  This becomes relevant when evaluating nanoparticles as potential drug delivery systems or assessing the toxicological impact of nanoparticles.  We have shown recently that instruments based on dynamic scattering of light from nanoparticles are likely to be inaccurate because they are based on fitting measurement data to the Stokes-Einstein equation.  In a paper published last month, we found that asymmetric flow field flow fractionation (or AF4)  in combination with dynamic light scattering when used to detect the size of nanoparticles in suspension, tended to over-estimate the diameter of particles smaller than 60 nanometres at low concentrations by upto a factor of two (see Giorgi et al, 2021).  Someone commented recently that our work in this area was not highly cited but perhaps this is unsurprising when it undermines a current paradigm.  We have certainly learnt to handle rejection letters, to redouble our efforts to demonstrate the rigor in our research and to present conclusions in a manner that appears to build on existing knowledge rather than demolishing it.

Sources:

Coglitore, D., Edwardson, S.P., Macko, P., Patterson, E.A. and Whelan, M., 2017. Transition from fractional to classical Stokes–Einstein behaviour in simple fluids. Royal Society open science, 4(12), p.170507.

Giorgi, F., Coglitore, D., Curran, J.M., Gilliland, D., Macko, P., Whelan, M., Worth, A. and Patterson, E.A., 2019. The influence of inter-particle forces on diffusion at the nanoscale. Scientific reports, 9(1), pp.1-6.

Giorgi, F., Curran, J.M., Gilliland, D., La Spina, R., Whelan, M.P. & Patterson, E.A. 2021, Limitations of nanoparticles size characterization by asymmetric flow field-fractionation coupled with online dynamic light scattering, Chromatographia, doi.org/10/1007/s10337-020-03997-7.

Image is a photograph of a fast flowing mountain river taken in Yellowstone National Park during a roadtrip across the USA in 2006.

Slowly crossing the valley of death

A view of a valleyThe valley of death in technology development is well-known amongst research engineers and their sponsors. It is the gap between discovery and application, or between realization of an idea in a laboratory and its implementation in the real-world. Some of my research has made it across the valley of death, for example the poleidoscope about 15 years ago (see ‘Poleidoscope (=polariscope+kaleidoscope)‘ on October 14th, 2020).  Our work on quantitative comparisons of data fields from physical measurements and computer predictions is about three-quarters of the way across the valley.  We published a paper in December (see Dvurecenska et al, 2020) on its application to a large panel from the fuselage of an aircraft based on work we completed as part of the MOTIVATE project.  I reported the application of the research in almost real-time in a post in December 2018 (see ‘Industrial Uncertainty‘ on December 12th, 2018) and in further detail in May 2020 as we submitted the manuscript for publication (‘Alleviating industrial uncertainty‘ on May 13th, 2020).  However, the realization in the laboratory occurred nearly a decade ago when teams from Michigan State University and the University of Liverpool came together in the ADVISE project funded by EU Framework 7 programme (see Wang et al, 2011). Subsequently, the team at Michigan State University moved to the University of Liverpool and in collaboration with researchers at Empa developed the technique that was applied in the MOTIVATE project (see Sebastian et al 2013). The work published in December represents a step into the valley of death; from a university environment into a full-scale test laboratory at Empa using a real piece of aircraft.  The MOTIVATE project involved a further step to a demonstration on an on-going test of a cockpit at Airbus which was also reported in a post last May (see ‘The blind leading the blind‘ on May 27th, 2020).  We are now working with Airbus in a new programme to embed the process of quantitative comparison of fields of measurements and predictions into their routine test procedures for aerospace structures.  So, I would like to think we are climbing out of the valley.

Image: not Death Valley but taken on a road trip in 2008 somewhere between Moab, UT and Kanab, UT while living in Okemos, MI.

Sources:

Dvurecenska, K., Diamantakos, I., Hack, E., Lampeas, G., Patterson, E.A. and Siebert, T., 2020. The validation of a full-field deformation analysis of an aircraft panel: A case study. The Journal of Strain Analysis for Engineering Design, p.0309324720971140.

Sebastian, C., Hack, E. and Patterson, E., 2013. An approach to the validation of computational solid mechanics models for strain analysis. The Journal of Strain Analysis for Engineering Design, 48(1), pp.36-47.

Wang, W., Mottershead, J.E., Sebastian, C.M. and Patterson, E.A., 2011. Shape features and finite element model updating from full-field strain data. International Journal of Solids and Structures, 48(11-12), pp.1644-1657.

For more posts on the MOTIVATE project: https://realizeengineering.blog/category/myresearch/motivate-project/

The MOTIVATE project has received funding from the Clean Sky 2 Joint Undertaking under the European Union’s Horizon 2020 research and innovation programme under grant agreement No. 754660 and the Swiss State Secretariat for Education, Research and Innovation under contract number 17.00064.

The opinions expressed in this blog post reflect only the author’s view and the Clean Sky 2 Joint Undertaking is not responsible for any use that may be made of the information it contains.

Scattering electrons reveal dislocations in material structure

Figure 9 from Yang et al, 2012. Map of plastic strain around the crack tip (0, 0) based on the full width of half the maximum of the discrete Fourier transforms of BSE images, together with thermoelastic stress analysis data (white line) and estimates of the plastic zone size based on approaches of Dugdale's (green line) and Irwin's (blue line; dimensions in millimetres).

Figure 9 from Yang et al, 2012. Map of plastic strain around the crack tip (0, 0) based on the full width of half the maximum of the discrete Fourier transforms of BSE images, together with thermoelastic stress analysis data (white line) and estimates of the plastic zone size based on approaches of Dugdale’s (green line) and Irwin’s (blue line; dimensions in millimetres).

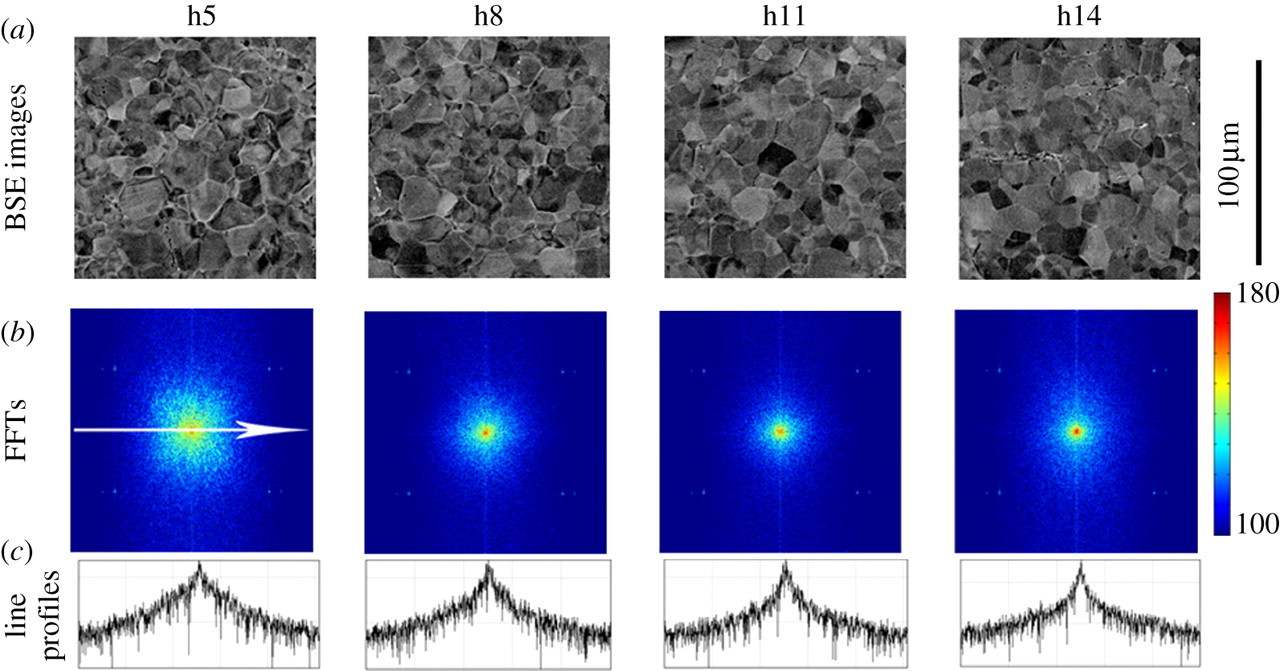
It is almost impossible to manufacture metal components that are flawless.  Every flaw or imperfection in a metallic component is a potential site for the initiation of a crack that could lead to the failure of the component [see ‘Alan Arnold Griffith’ on April 26th, 2017].  Hence, engineers are very interested in understanding the mechanisms of crack initiation and propagation so that these processes can be prevented or, at least, inhibited.  It is relatively easy to achieve these outcomes by not applying loads that would supply the energy to drive failure processes; however, the very purpose of a metal component is often to carry load and hence a compromise must be reached.  The deep understanding of crack initiation and propagation, required for an effective and safe compromise, needs detailed measurements of evolution of the crack and of its advancing front or tip [depending whether you are thinking in three- or two-dimensions].  When a metal is subjected to repeated cycles of loading, then a crack can grow incrementally with each load cycle; and in these conditions a small volume of material, just ahead of the crack and into which the crack is about to grow, has an important role in determining the rate of crack growth.  The sharp geometry of the crack tip causes localisation of the applied load in the material ahead of the crack thus raising the stress sufficiently high to cause permanent deformation in the material on the macroscale.  The region of permanent deformation is known as the crack tip plastic zone.  The permanent deformation induces disruptions in the regular packing of the metal atoms or crystal lattice, which are known as dislocations and continued cyclic loading causes the dislocations to move and congregate around the crack tip.  Ultimately, dislocations combine to form voids in the material and then voids coalesce to form the next extension of the crack.  In reality, it is an oversimplification to refer to a crack tip because there is a continuous transition from a definite crack to definitely no crack via a network of loosely connected voids, unconnected voids, aggregated dislocations almost forming a void, to a progressively more dispersed crowd of dislocations and finally virgin or undamaged material.  If you know where to look on a polished metal surface then you could probably see a crack about 1 mm in length and, with aid of an optical microscope, you could probably see the larger voids forming in the material ahead of the crack especially when a load is applied to open the crack.  However, dislocations are very small, of the order tens of nanometres in steel, and hence not visible in an optical microscope because they are smaller than the wavelength of light.  When dislocations congregate in the plastic zone ahead of the crack, they disturb the surface of the metal and causing a change its texture which can be detected in the pattern produced by electrons bouncing off the surface.  At Michigan State University about ten years ago, using backscattered electron (BSE) images produced in a scanning electron microscope (SEM), we demonstrated that the change in texture could be measured and quantified by evaluating the frequency content of the images using a discrete Fourier transform (DFT).  We collected 225 square images arranged in a chessboard pattern covering a 2.8 mm by 2.8 mm square around a 5 mm long crack in a titanium specimen which allowed us to map the plastic zone associated with the crack tip (figure 9 from Yang et al, 2012).  The length of the side of each image was 115 microns and 345 pixels so that we had 3 pixels per micron which was sufficient to resolve the texture changes in the metal surface due to dislocation density.  The images are from our paper published in the Proceedings of the Royal Society and the one below (figure 4 from Yang et al, 2012) shows four BSE images along the top at increasing distances from the crack tip moving from left to right.  The middle row shows the corresponding results from the discrete Fourier transform that illustrate the decreasing frequency content of the images moving from left to right, i.e. with distance from the crack.  The graphs in the bottom row show the profile through the centre of the DFTs.  The grain structure in the metal can be seen in the BSE images and looks like crazy paving on a garden path or patio.  Each grain has a particular and continuous crystal lattice orientation which causes the electrons to scatter differently from it compared to its neighbour.  We have used the technique to verify measurements of the extent of the crack tip plastic zone made using thermoelastic stress analysis (TSA) and then used TSA to study ‘Crack tip plasticity in reactor steels’ [see post on March 13th, 2019].

Figure 4 from Yang et al, 2012. (a) Backscattered electron images at increasing distance from crack from left to right; (b) their corresponding discrete Fourier transforms (DFTs) and (c) a horizontal line profile across the centre of each DFT.

Figure 4 from Yang et al, 2012. (a) Backscattered electron images at increasing distance from crack from left to right; (b) their corresponding discrete Fourier transforms (DFTs) and (c) a horizontal line profile across the centre of each DFT.

Reference: Yang, Y., Crimp, M., Tomlinson, R.A., Patterson, E.A., 2012, Quantitative measurement of plastic strain field at a fatigue crack tip, Proc. R. Soc. A., 468(2144):2399-2415.