Category Archives: mechanics

Iron Nanochains

Caustics formed from iron nanoparticles coalescing into chains aligned with the lines of the magnetic field from an adjacent magnet

Many people will be familiar with an iron filings and magnet experiment often performed in high school physics classes.  Iron filings on a sheet of paper with a magnet underneath, when the paper is gently tapped, align with the lines of the magnetic field sometimes forming ‘chains’.  In our research group, we have performed a version of this experiment at the nanoscale using iron nanoparticles smaller than 200nm in diameter floating in deionised water on a microscope slide.  We brought a magnet into close proximity with the slide and the nanoparticles formed chains aligned along the lines of magnetic field which we visualised using caustics [see ‘Holes in fluids’ on October 22, 2014].  When we removed the magnet, the nanoparticles resumed their Brownian motion.  Not a ground-breaking experiment but it’s exciting to be able to demonstrate that the phenomenon occurs at the nanoscale and that we can observe it.

Passive nanorheology measurements

What do marshmallows, jelly (or Jell-O), cream cheese and Chinese soup dumplings have in common?  They are often made with gelatin.  Gelatin is derived from the skin and bones of cattle and pigs through the partial hydrolysis of collagen.  Gelatin is a physical hydrogel meaning that it consists of a three-dimensional network of polymer molecules in which a large amount of water is absorbed, as much as 90% in gelatin.  These polymer molecules are cross-linked by hydrogen bonds, hydrophobic interactions and chain entanglements.  External stimuli, such as temperature, can change the level of cross-linking causing the material to transition between its solid, liquid and gel states.  This is why jelly sets in the fridge and melts when it’s heated up – the cross-links holding the molecules together break down.  This type of responsive behaviour allows the properties of hydrogels to be controlled at the micro and sub-micron scale for a host of applications including tissue engineering, drug delivery, water treatment, wearable technologies, and supercapacitors.  However, the design and manufacture of soft hydrogels can be challenging due to the lack of technology for measuring the local properties.  Current quantitative techniques for measuring the properties of hydrogels usually focus on bulk properties and provide little data about local variations or real-time responses to external stimuli.  My colleagues and I have used gold nanoparticles as probes in hydrogels to map the properties at the microscale of thermosensitive hydrogels undergoing real-time transition from the solid to gel phases [see ‘Passive nanorheological tool to characterise hydrogels’].  This is an extension, or perhaps more accurately an application, of our earlier work on tracking nanoparticles through the vitreous humour of the eye [see ‘Nanoparticle motion-through heterogeneous hydrogels’ on November 6th, 2024].  The novel technique, which yields passive nanorheological measurements, allows us to evaluate local viscosity, identify time-varying heterogeniety and monitor dynamic phase transitions at the micro through to nano scale.  The significant challenges of other techniques, such as weak signals due to high water content and the dynamism of hydrogels, are overcome with a fast, inexpensive and user-friendly technology.  Although, even with these advantages, you are unlikely to use it when you are making jelly or roasting marshmallows over the campfire; however, it is really useful for understanding the transport of drugs through biological hydrogels or designing manufacturing processes for artificial tissue.

Reference

Moira Lorenzo Lopez, Victoria R. Kearns, Eann A. Patterson & Judith M. Curran, Passive nanorheological tool to characterise hydrogels, Nanoscale, 2025,17, 15338-15347.

Image: Figure 5 from the above reference showing a hydrogel transitioning to a gel phase as result of an increase in temperature with 100 nm diameter gold nanoparticles with some particles (yellow arrows) at the interface between phases.  The image was taken in an inverted optical microscope set up for tracking the nanoparticles.

Star sequence minimises distortion

It is some months since I have written about engineering so this post is focussed on some mechanical engineering.  The advent of pneumatic and electric torque wrenches has made it impossible for the ordinary motorist to change a wheel because it is very difficult to loosen wheel nuts by hand when they have been tightened by a powered wrench which most of us do not have available.  This has probably made motoring safer but also means we are more likely to need assistance when we have a flat tire.  It also means that the correct tightening pattern for nuts and bolts is less widely known.  A star-shaped sequence is optimum, i.e., if you have six bolts numbered sequentially around a circle then you start with #1, move across the diameter to #4, then to #2 followed by #5 across the diameter, then to #3 and across the diameter to #6.  This sequence is optimum for flanges, bolted joints in the frames of buildings and joining machine parts as well as wheel nuts.  We have recently discovered that it works in reverse, in the sense that it is the optimum sequence for releasing parts made by additive manufacturing (AM) from the baseplate of the AM machine (see ‘If you don’t succeed try and try again’ on September 29th, 2021).  Additive manufacturing induces large residual stresses as a consequence of the cycles of heat input to the part during manufacturing and some of these stresses are released when it is removed from the baseplate of the AM machine, which causes distortion of the part.  Together with a number of collaborators, I have been researching the most effective method of building thin flat plates using additive manufacturing (see ‘On flatness and roughness’ on January 19th, 2022).  We have found that building the plate vertically layer-by-layer works well when the plate is supported by buttresses on its edges.  We have used two in-plane buttresses and four out-of-plane buttresses, as shown in the photograph, to achieve parts that have comparable flatness to those made using traditional methods.  It turns out that optimum order for the removal of the buttresses is the same star sequence used for tightening bolts and it substantially reduces distortion of the plate compared to some other sequences.  Perhaps in retrospect, we should not be surprised by this result; however, hindsight is a wonderful thing.

The current research is funded jointly by the National Science Foundation (NSF) in the USA and the Engineering and Physical Sciences Research Council (EPSRC) in the UK and the project was described in ‘Slow start to an exciting new project on thermoacoustic response of AM metals’ on September 9th 2020.

Image: Photograph of a geometrically-reinforced thin plate (230 x 130 x 1.2 mm) built vertically layer-by-layer using the laser powder bed fusion process on a baseplate (shown removed from the AM machine) with the supporting buttresses in place.

Sources:

Patterson EA, Lambros J, Magana-Carranza R, Sutcliffe CJ. Residual stress effects during additive manufacturing of reinforced thin nickel–chromium plates. IJ Advanced Manufacturing Technology;123(5):1845-57, 2022.

Khanbolouki P, Magana-Carranza R, Sutcliffe C, Patterson E, Lambros J. In situ measurements and simulation of residual stresses and deformations in additively manufactured thin plates. IJ Advanced Manufacturing Technology; 132(7):4055-68, 2024.

More on fairy lights and volume decomposition (with ice cream included)

Explanation in textLast June, I wrote about representing five-dimensional data using a three-dimensional stack of transparent cubes containing fairy lights whose brightness varied with time and also using feature vectors in which the data are compressed into a relatively short string of numbers [see ‘Fairy lights and decomposing multi-dimensional datasets’ on June 14th, 2023].  After many iterations, we have finally had an article published describing our method of orthogonally decomposing multi-dimensional data arrays using Chebyshev polynomials.  In this context, orthogonal means that components of the resultant feature vector are statistically independent of one another.  The decomposition process consists of fitting a particular form of polynomials, or equations, to the data by varying the coefficients in the polynomials.  The values of the coefficients become the components of the feature vector.  This is what we do when we fit a straight line of the form y=mx+c to set of values of x and y and the coefficients are m and c which can be used to compare data from different sources, instead of the datasets themselves.  For example, x and y might be the daily sales of ice cream and the daily average temperature with different datasets relating to different locations.  Of course, it is much harder for data that is non-linear and varying with w, x, y and z, such as the intensity of light in the stack of transparent cubes with fairy lights inside.  In our article, we did not use fairy lights or icecream sales, instead we compared the measurements and predictions in two case studies: the internal stresses in a simple composite specimen and the time-varying surface displacements of a vibrating panel.

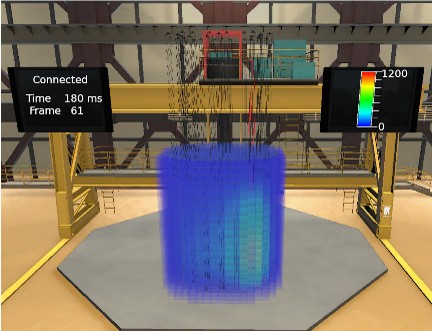
The image shows the normalised out-of-plane displacements as the colour as a function of time in the z-direction for the surface of a panel represented by the xy-plane.

Source:

Amjad KH, Christian WJ, Dvurecenska KS, Mollenhauer D, Przybyla CP, Patterson EA. Quantitative Comparisons of Volumetric Datasets from Experiments and Computational Models. IEEE Access. 11: 123401-123417, 2023.