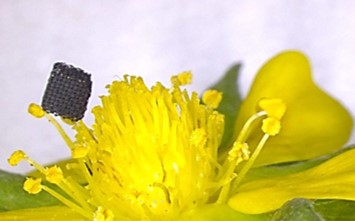
Some years ago I wrote with great excitement about publishing a paper in Royal Society Open Science [see ‘Press release!‘ on November 15th, 2017]. This has become a routine event; however, the excitement returned earlier this month when we had a paper published in the Proceedings of Royal Society of London on ‘A thermal emissions-based real-time monitoring system for in situ detection of cracks’. The Proceedings were first published in February 1831 and this is only the second time in my career that my group has published a paper in them. The last time was ten years ago and was also about cracks: ‘Quantitative measurement of plastic strain field at a fatigue crack tip’. I have already described this earlier work in a post [see ‘Scattering electrons reveal dislocations in material structure’ on November 11th, 2020]. This was the first time that the size and shape of the plastic zone around a crack had been measured directly rather than inferred from other measurements. It required an expensive scanning electron microscope and a well-equipped laboratory. In contrast, the work in the paper published this month uses components that can be purchased for the price of a smart phone and assembled into a device not much larger than a smart phone. The device detects the changes in the temperature distribution over the surface of the metal caused by the propagation of a crack due to repeated loading of the metal. It is based on the principles of thermoelastic stress analysis [see ‘Counting photons to measure stress‘ on November 18th, 2015], which is a well-established measurement technique that usually requires expensive infra-red cameras. Our key innovation is to not aim for absolute measurement values, which allows us to ignore calibration requirements, and instead to look for changes in the temperature distribution on the metal surface by extracting feature vectors from the images [see ‘Recognising strain‘ on October 28th 2015]. Our approach lowers the cost of the equipment required by several orders of magnitude, achieves comparable or better resolution of crack growth (around 1 mm) and will function at lower loading frequencies than techniques based on classical thermoelastic stress analysis. Besides crack analysis, the common theme of the two papers is the innovative use of image processing to identify change, based on the fracture mechanics of crack propagation.
The research reported in this month’s paper was largely performed as part of the DIMES project about which I have written many posts.
The University of Liverpool was the coordinator of the DIMES project and the other partners were Empa, Dantec Dynamics GmbH and Strain Solutions Ltd. Airbus was the topic manager on behalf of the Clean Sky 2 Joint Undertaking.
 The DIMES project received funding from the Clean Sky 2 Joint Undertaking under the European Union’s Horizon 2020 research and innovation programme under grant agreement No. 820951.
The opinions expressed in this blog post reflect only the author’s view and the Clean Sky 2 Joint Undertaking is not responsible for any use that may be made of the information it contains.
References:
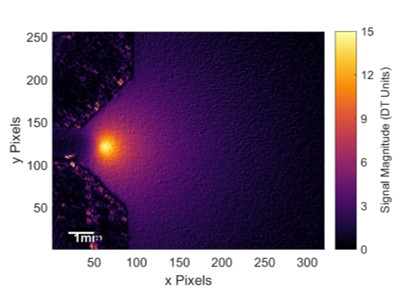
Amjad, K., Lambert, C.A., Middleton, C.A., Greene, R.J., Patterson, E.A., 2022, A thermal emissions-based real-time monitoring system for in situ detection of cracks, Proc. R. Soc. A., doi: 10.1098/rspa.2021.0796.
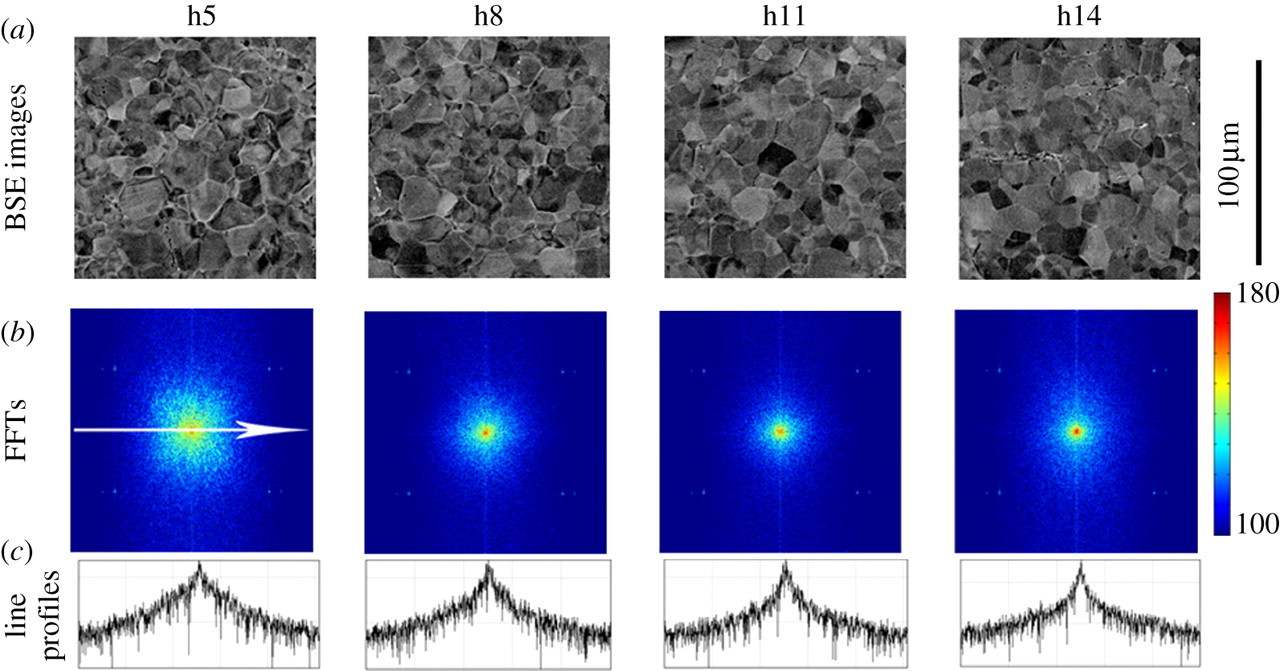
Yang, Y., Crimp, M., Tomlinson, R.A., Patterson, E.A., 2012, Quantitative measurement of plastic strain field at a fatigue crack tip, Proc. R. Soc. A., 468(2144):2399-2415.
Image: Figure 8 from Amjad et al, 2022, Proc. R. Soc. A., doi: 10.1098/rspa.2021.0796.