 I am writing this post while I am in the middle of leading a breakout activity for more than a hundred PhD students from our Centres for Doctoral Training in nuclear science and engineering, GREEN and SATURN. We have asked them to construct a knowledge network for a start-up company commissioned to build either a fusion energy power station or a power station based on small modular reactors (SMRs). A knowledge network is a web of expertise and information whose value comes from the connections and interactions within and outside an organization. Our aim is to encourage students to think beyond science and engineering and consider the interactions required to deliver safe, economic nuclear power.
We have brought the students together in York from six universities located in the North of England (Lancaster, Leeds, Liverpool, Manchester & Sheffield) and Scotland (Strathclyde). This is an annual event usually held in the first working week of the New Year (see ‘Nuclear Winter School’ on January 23rd 2019).
The breakout activity has three one-hour time-slots on three consecutive days. In today’s time-slot, we have divided the students into twenty groups of seven and given them paper, pencils, and a circle stencil plus an eraser with which to draw knowledge networks. We are hoping for creativity, lively discussions, and some fun. In yesterday’s one-hour slot, they had briefings from the Chief Manufacturing Engineer for a company building SMRs and the Deputy Chief Engineer of a company developing a fusion power station, as well as from a Digital Knowledge Management Consultant whose PhD led to a paper on knowledge networks, which we shared with the students last month (see ‘Evolutionary model of knowledge management’ on March 6th, 2024). Tomorrow, one person from each group will have two minutes to present their knowledge network, via a portable visualiser, to an audience of several hundred. What can go wrong? Twenty two-minute presentations in one hour with one minute for questions and changeover.
GREEN (Growing skills for Reliable Economic Energy from Nuclear) is co-funded by a consortia of industrial organisations and the UK EPSRC (grant no. EP/S022295/1).
SATURN (Skills And Training Underpinning a Renaissance in Nuclear) succeeded GREEN and is also co-funded by a consortia of industrial organisations and the UK EPSRC (grant no. EP/Y034856/1).
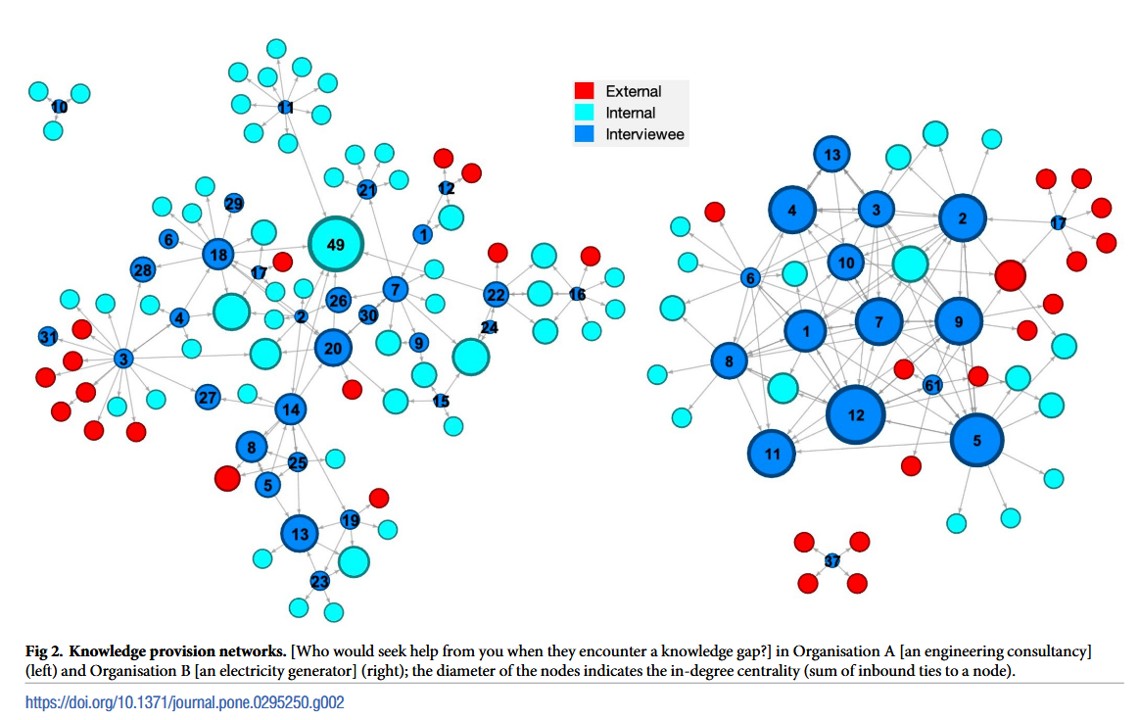
Image shows thumbnail of figure from shared paper with knowledge networks for an engineering consultancy company and an electricity generator, follow this link for full size image.


