Tag Archives: aerospace

More on fairy lights and volume decomposition (with ice cream included)

Explanation in textLast June, I wrote about representing five-dimensional data using a three-dimensional stack of transparent cubes containing fairy lights whose brightness varied with time and also using feature vectors in which the data are compressed into a relatively short string of numbers [see ‘Fairy lights and decomposing multi-dimensional datasets’ on June 14th, 2023].  After many iterations, we have finally had an article published describing our method of orthogonally decomposing multi-dimensional data arrays using Chebyshev polynomials.  In this context, orthogonal means that components of the resultant feature vector are statistically independent of one another.  The decomposition process consists of fitting a particular form of polynomials, or equations, to the data by varying the coefficients in the polynomials.  The values of the coefficients become the components of the feature vector.  This is what we do when we fit a straight line of the form y=mx+c to set of values of x and y and the coefficients are m and c which can be used to compare data from different sources, instead of the datasets themselves.  For example, x and y might be the daily sales of ice cream and the daily average temperature with different datasets relating to different locations.  Of course, it is much harder for data that is non-linear and varying with w, x, y and z, such as the intensity of light in the stack of transparent cubes with fairy lights inside.  In our article, we did not use fairy lights or icecream sales, instead we compared the measurements and predictions in two case studies: the internal stresses in a simple composite specimen and the time-varying surface displacements of a vibrating panel.

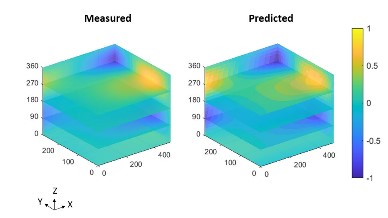
The image shows the normalised out-of-plane displacements as the colour as a function of time in the z-direction for the surface of a panel represented by the xy-plane.

Source:

Amjad KH, Christian WJ, Dvurecenska KS, Mollenhauer D, Przybyla CP, Patterson EA. Quantitative Comparisons of Volumetric Datasets from Experiments and Computational Models. IEEE Access. 11: 123401-123417, 2023.

Conflicted about cost-benefit analysis of international conferences

Decorative image of an aircraftLast week I wrote about my stimulating experience of attending a conference in Orlando, Florida and presenting our recent research to the experimental mechanics community for the first time in four years.  Whilst there, I was conscious of the ecological footprint of my trip – the venue was making extensive use of single use plastics on a scale that surprised me.  However, my trans-Atlantic flight had an order of magnitude larger impact.  It is difficult to find a reliable estimate of the carbon emissions for a return flight between the UK and Florida but 1,267 kg CO2 from the Guardian newspaper website lies between a lower bound estimate of 856 kg CO2 from iata.org and and an upper bound of 2,200 kg CO2 from myclimate.org.  This is equivalent to about one-sixth of my annual domestic carbon footprint of 9,000 kg CO2 using the calculator on the World Wildlife Fund website.  The UK average footprint is 9,300 kg CO2/capita and the global average is 6,300 kg CO2/capita.  The question is whether it is justifiable to generate additional emissions to attend a research conference?  The prime motivation of the research that I presented is to support the development of aircraft which are lighter with less embedded carbon and use less energy while also having a longer useful life.  Ultimately, supporting the aviation industry to achieve its target of zero-net emissions by 2050.  The carbon emissions of the global aviation industry in 2021 were 720 Mt CO2 [see IEA report]; hence, if my research contributes towards one hundredth of a percent reduction in these emissions then this would be 72,000 kg CO2/year.  It seems reasonable to cause a tenth of this annual saving each year (7,200 kg CO2/year) for the next ten years in order to deliver the required technology, i.e., committing one year’s savings to achieve an annual saving in perpetuity.  The problem is that I do not have a reliable estimate of the carbon footprint of my research activities.  I supervised an MSc student a couple of years ago who conducted a carbon audit of the School of Engineering and estimated the carbon emissions due to research alone to be 61,531 kg CO2 excluding heating, lighting and travel.  My group might be responsible for 10% of these emissions, i.e., about 6000 kg CO2; hence, adding about 1,200 kg CO2 to interact with other researchers at a conference seems reasonable and within a budget of 7,200 kg CO2. However, it is difficult to find reliable data to use in estimating carbon emissions for these activities and so perhaps the key conclusion is that we need more and better carbon audits to allow more informed decision-making.  In the meantime, perhaps attendence at an international conference once every four years is sufficient.

Image: Tayeb Mezahdia

Reasons I became an engineer: #4

Images from the optical microscope showing the tracks of bacteria interacting with a surfaceThis is the last in a series of posts reflecting on my steps towards becoming an engineer.  At the end of the previous post, I described how I moved to Canada becoming a biomedical engineer in the Medical School at the University of Calgary.  It was a brief period of my career, because shortly after I started, I was encouraged to apply for a lectureship in mechanical engineering at my alma mater which I did successfully.  So, I returned to the University of Sheffield and started my career as an academic engineer.  I continued to work in biomedical engineering, focussing initially on cardiac mechanics [see ‘Tears in the heart’ on July 20th, 2022], then on osseointegrated prostheses [see ‘Turning the screw in dentistry’ on September 9th, 2020] and, more recently, on computational biology [see ‘Hierarchical modelling in engineering and biology’ on March 14th, 2018] and cellular dynamics [see ‘Label-free real-time tracking of individual bacterium’ on January 25th, 2023].  However, the dominant application area of my research has been aerospace engineering informed by, if not also influenced by, my experiences in the Royal Navy, including flying a jet trainer aircraft shortly before leaving.  In the last decade, I have been introduced to nuclear reactor engineering, both fission and fusion, and have used them as vehicles for developing research in digital engineering [see ‘Thought leadership in fusion engineering’ on October 9th, 2019].  This biographical series of posts has described my evolution as an engineer – it was not an ambition I ever had nor did anyone push me towards engineering but I have found that my way of thinking about problems is well-suited to engineering, or perhaps engineering has taught me a way of thinking.

Image: Figure 4 – Tracks (yellow lines) of the sections (purple circles) of four E. coli bacteria experiencing: (a) random diffusion above the surface; (b) rotary attachment; (c) lateral attachment; (d) static attachment. The dynamics of the four bacteria was monitored for approximately 20 s. The length of the scale bars is 5 μm. From Scientific Reports, 12:18146, 2022.

Taking an aircraft’s temperature as a health check

The title of this post is the title of a talk that I will deliver during the Pint of Science Festival in Liverpool later this month.  At last year’s festival I spoke about the very small: Revealing the invisible: real-time motion of virus particles [see ‘Fancy a pint of science‘ on April 27th, 2022].  This year I am moving up the size scale and from biomedical engineering to aerospace engineering to talk about condition monitoring in aircraft structures based on our recent research in the INSTRUCTIVE [see ‘INSTRUCTIVE final reckoning‘ on January 9th 2019] and DIMES [see ‘Our last DIMES‘ on September 22, 2021] projects.  I am going describe how we have reduced the size and cost of infrared instrumentation for monitoring damage propagation in aircraft structures while at the same time increasing the resolution so that we can detect 1 mm increments in crack growth in metals and 6 mm diameter indications of damage in composite materials.  If you want to learn more how we did it and fancy a pint of science, then join us in Liverpool later this month for part of the world’s largest festival of public science.  This year we have a programme of engineering talks on Hope Street in Frederiks on May 22nd and in the Philharmonic Dining Rooms on May 23rd where I be the second speaker.

The University of Liverpool was the coordinator of the DIMES project and the other partners were Empa, Dantec Dynamics GmbH and Strain Solutions Ltd.  Strain Solutions Limited was the coordinator of the INSTRUCTIVE project in which the other participant was the University of Liverpool.  Airbus was the project manager for both projects.

The DIMES and INSTRUCTIVE projects  received funding from the Clean Sky 2 Joint Undertaking under the European Union’s Horizon 2020 research and innovation programme under grant agreement No. 820951 and 6968777 respectively.

The opinions expressed in this blog post reflect only the author’s view and the Clean Sky 2 Joint Undertaking is not responsible for any use that may be made of the information it contains.