Category Archives: structures

All arms and legs

Imagine building a humanoid robot with head, arms and legs from different organisations that will not share the technical details of the products, probably because they are worried about their intellectual property being stolen.  The likely result would be a robot that moves in slow uncoordinated jerky steps, unlike those seen at the recent World Humanoid Robot Games in China where a humanoid robot beat Usain Bolt’s 100m record.  We have encountered this problem in attempting to build an industrial metaverse consisting of a connected series of digital twins [see ‘Digital twins that thrive in the real-world’ on June 9th, 2021] that represent different parts of a complex engineering system, e.g., a power station.  The organisations that have developed the digital twins or computer simulations are reluctant to share technical information because they want to protect their intellectual property.  Our solution has been to develop an apex software architecture that seamlessly and securely connects computer models of all of the parts of the system with high-speed two-way exchange of information – the equivalent of the central nervous system in the humanoid robot.  Our architecture reduced the processing times for simulations of a nuclear reactor sixteen-fold compared to current approaches and required one-third of the number of analysts to perform the simulations.  The architecture is readily adaptable too; you can plug n’ play with different computational models – the equivalent to changing a leg on a humanoid robot using a snap-fit connector.  Read our 2022 paper if you would like to know more or get in touch if you would like to use our apex architecture.

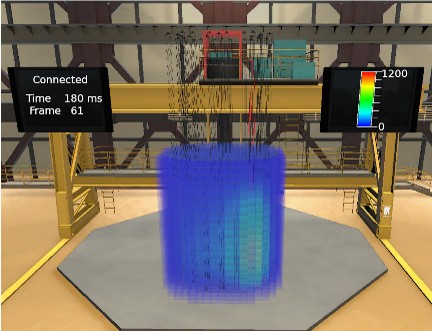
Image: Figure 9b from Bowman et al, 2022, showing simulated power distribution and control rod position overlayed on a model of a PWR reactor.

Reference: Bowman D, Dwyer L, Levers A, Patterson EA, Purdie S, Vikhorev K. A unified approach to digital twin architecture—proof-of-concept activity in the nuclear sector. IEEE Access, 10:44691-709, 2022
Mapping the road between digital twins and NDE

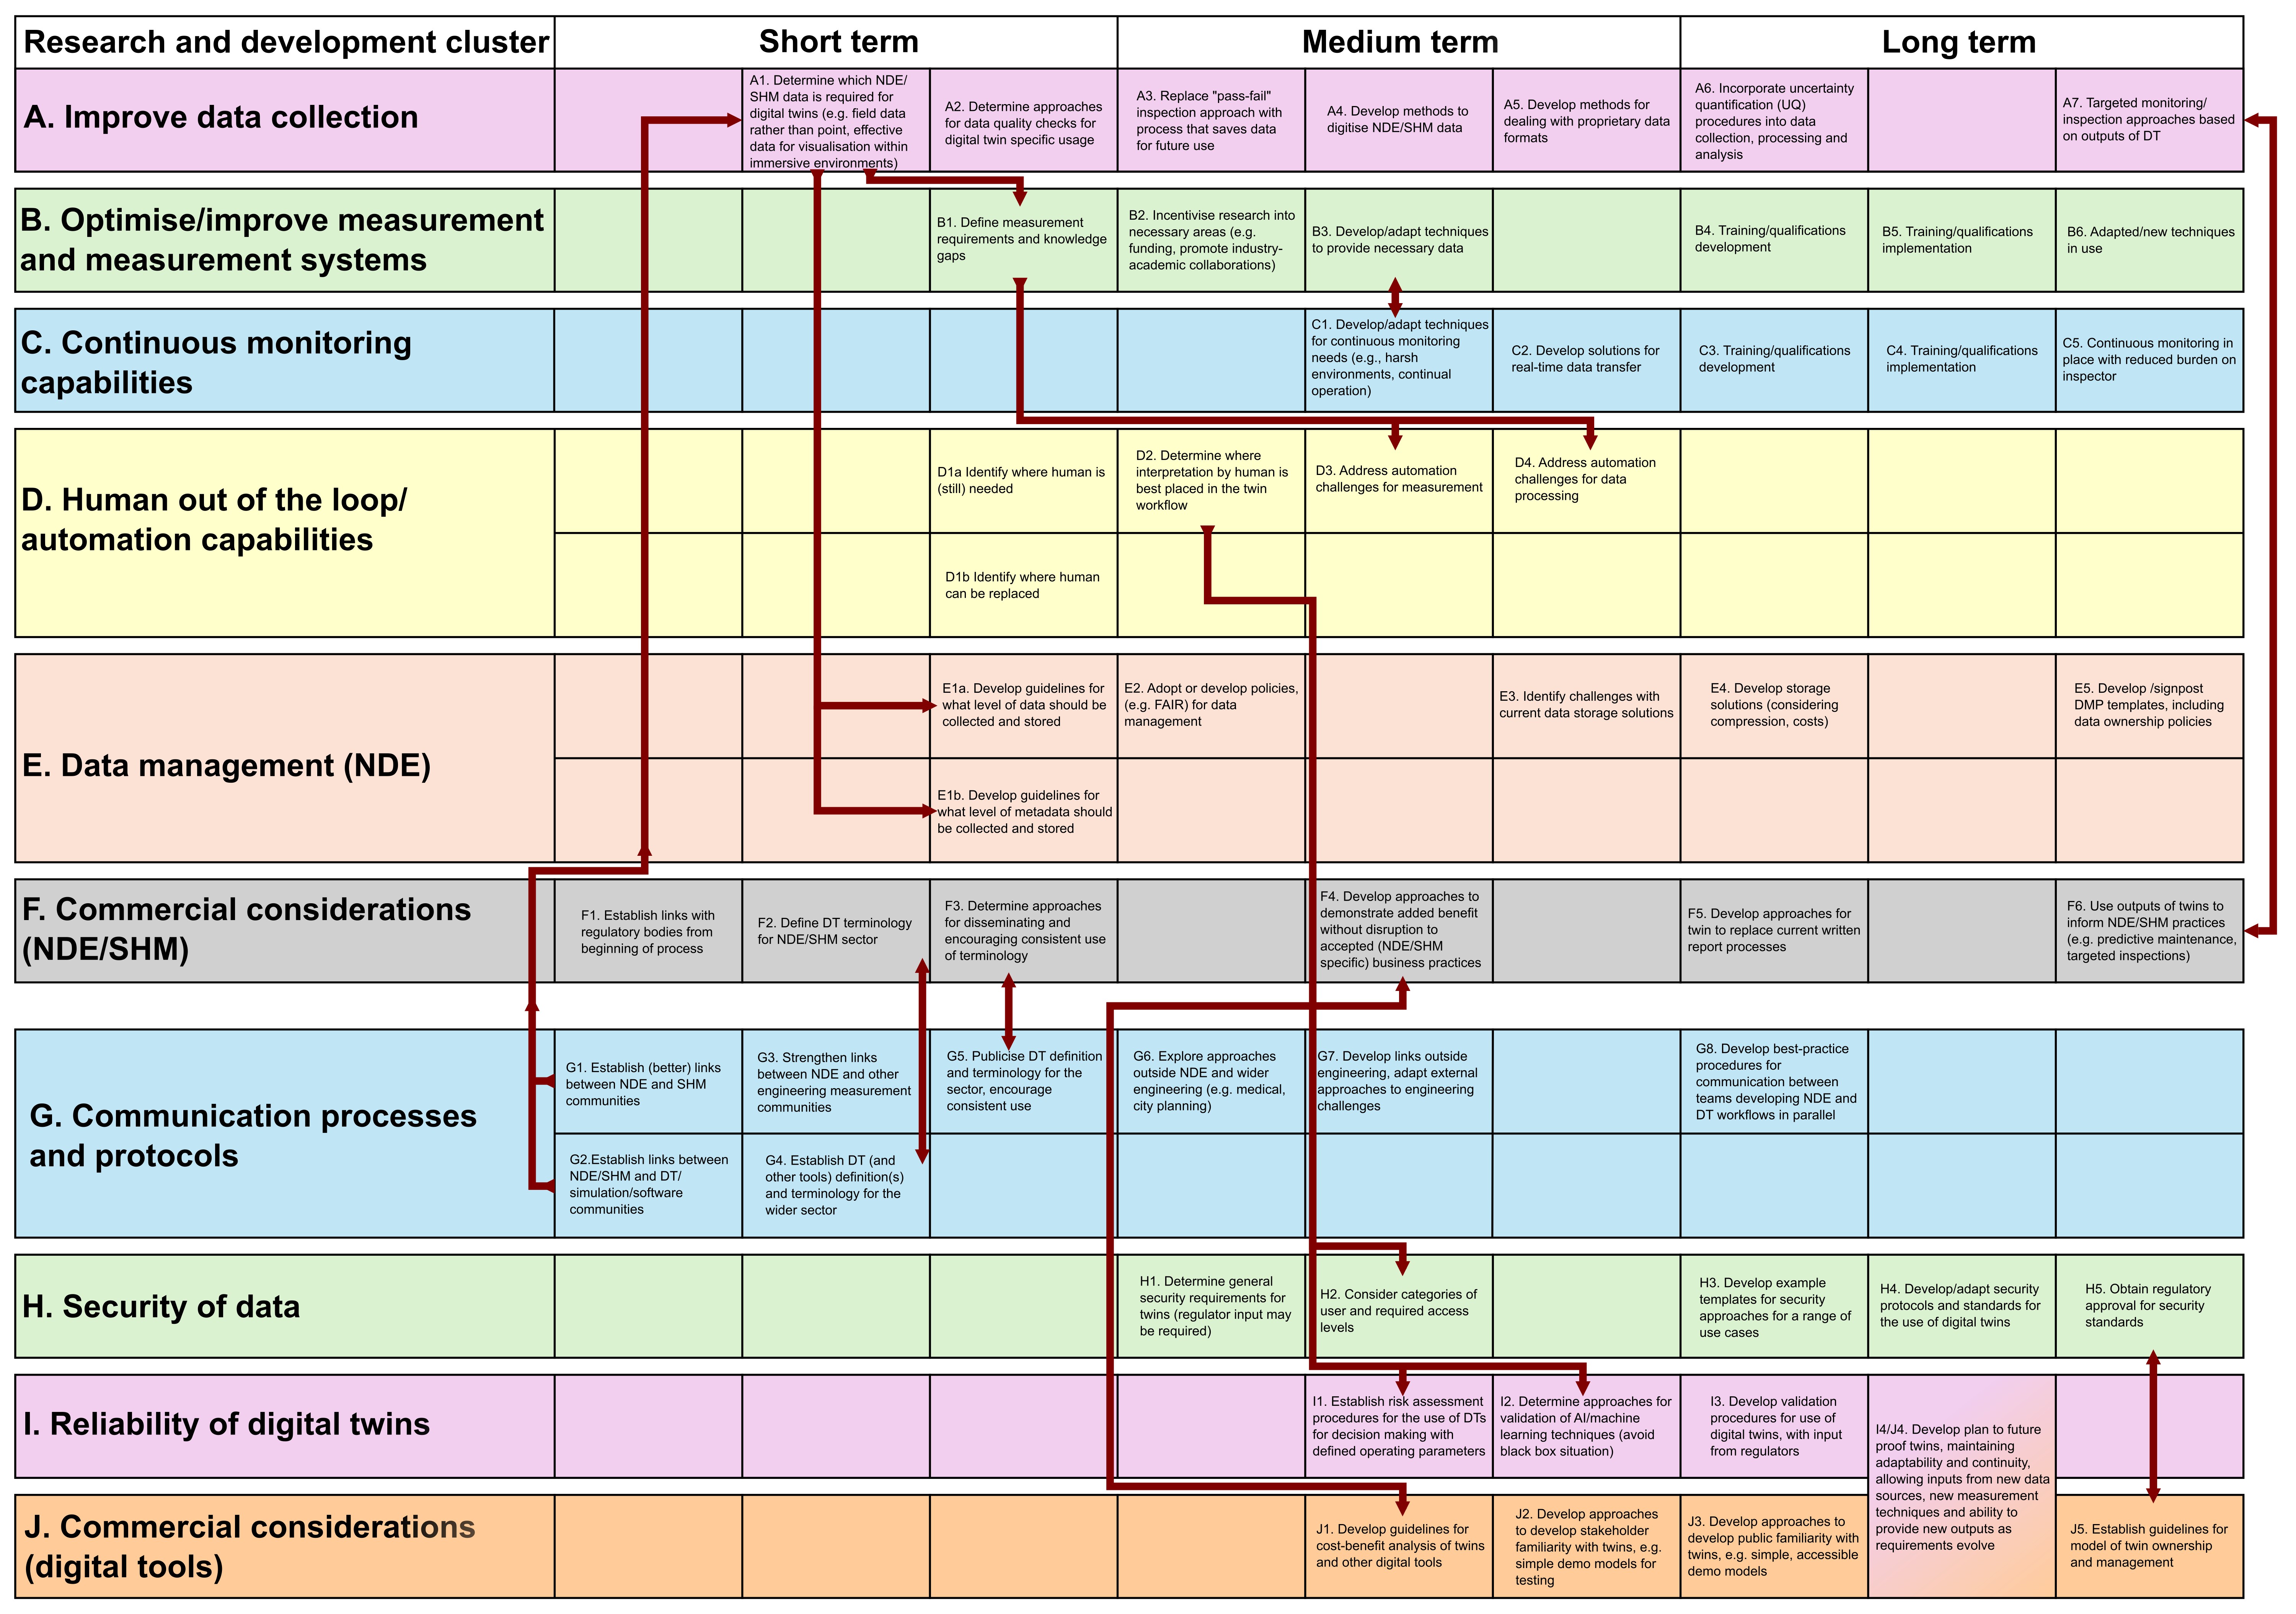
RoadmapMichael Grieves, who probably first formulated the concept of digital twins in 2002, stated that all information about a physical entity should be present in its cyber or digital twin with data flow from the physical entity to the digital twin, and information flow from the digital twin to the physical entity throughout its lifecycle [1] [see ‘Digital twins that thrive in the real-world’ on June 9th, 2021].  The realisation of data flows between cyber-physical twins has been slow and there are relatively few cases where this definition has been fully implemented.  Non-destructive evaluation (NDE) is a well-established set of techniques used to assess the properties, integrity and condition of engineering components and structures that could play a significant role in supplying data to digital twins.  At the moment NDE is commonly used in quality control to check for manufacturing defects, in integrity assessments to investigate damage in safety critical components during maintenance inspections, and for determining the remaining life expectancy of engineering parts.  The integration of NDE in digital engineering has been slow; so, in a recent study, involving representatives from a wide range of industries, we have defined in a roadmap [2] the potential opportunity and the route to its realisation.  This work represents a different approach to research for my group in that we have explored the need or the ‘pull’ from industry rather than delivering innovative technology which can result in a ‘push’ to industry [see for example, ‘Our last DIMES’ on September 22nd, 2021].  My regular readers might also detect the influence of social science, which also surfaced in our recent work on knowledge management [see ‘Opportunities lost in knowledge management using digital technology’ on October 25th, 2023 and ‘Evolutionary model of knowledge management’ on March 6th 2024].  We have used the same methods, based on semi-structured interviews and thematic analysis, across all of these studies.

Image: roadmap [© University of Liverpool] which should be read in conjunction with [2].

References:

  1. Grieves, M., Vickers, J. (2017). Digital Twin: Mitigating Unpredictable, Undesirable Emergent Behavior in Complex Systems. In: Kahlen, J., Flumerfelt, S., Alves, A. (eds) Transdisciplinary Perspectives on Complex Systems. Springer, Cham.
  2. Middleton CA, Nguyen T & Patterson EA, NDE4.0 and digital twins in industry: current user experiences and future development, J. Nondestructive Evaluation, 45:107, 2026.

More on fairy lights and volume decomposition (with ice cream included)

Explanation in textLast June, I wrote about representing five-dimensional data using a three-dimensional stack of transparent cubes containing fairy lights whose brightness varied with time and also using feature vectors in which the data are compressed into a relatively short string of numbers [see ‘Fairy lights and decomposing multi-dimensional datasets’ on June 14th, 2023].  After many iterations, we have finally had an article published describing our method of orthogonally decomposing multi-dimensional data arrays using Chebyshev polynomials.  In this context, orthogonal means that components of the resultant feature vector are statistically independent of one another.  The decomposition process consists of fitting a particular form of polynomials, or equations, to the data by varying the coefficients in the polynomials.  The values of the coefficients become the components of the feature vector.  This is what we do when we fit a straight line of the form y=mx+c to set of values of x and y and the coefficients are m and c which can be used to compare data from different sources, instead of the datasets themselves.  For example, x and y might be the daily sales of ice cream and the daily average temperature with different datasets relating to different locations.  Of course, it is much harder for data that is non-linear and varying with w, x, y and z, such as the intensity of light in the stack of transparent cubes with fairy lights inside.  In our article, we did not use fairy lights or icecream sales, instead we compared the measurements and predictions in two case studies: the internal stresses in a simple composite specimen and the time-varying surface displacements of a vibrating panel.

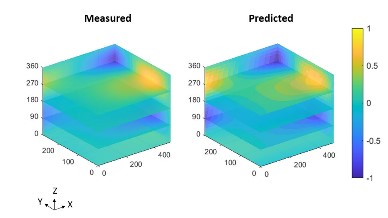
The image shows the normalised out-of-plane displacements as the colour as a function of time in the z-direction for the surface of a panel represented by the xy-plane.

Source:

Amjad KH, Christian WJ, Dvurecenska KS, Mollenhauer D, Przybyla CP, Patterson EA. Quantitative Comparisons of Volumetric Datasets from Experiments and Computational Models. IEEE Access. 11: 123401-123417, 2023.

Predicting release rates of hydrogen from stainless steel

Decorative photograph showing electrolysis cellThe influence of hydrogen on the structural integrity of nuclear power plant, where water molecules in the coolant circuit can be split by electrolysis or radiolysis to produce hydrogen, has been a concern to engineers for decades.  However, plans for a hydrogen economy and commercial fusion reactors, in which plasma-facing structural components will likely be exposed to hydrogen, has accelerated interest in understanding the complex interactions of hydrogen with metals, especially in the presence of irradiation.  A key step in advancing our understanding of these interactions is the measurement and prediction of the uptake and release of hydrogen by key structural materials.  We have recently published a study in Scientific Reports in which we developed a method for predicting the amount hydrogen in a steel under test conditions.  We used a sample of stainless steel as an electrode (cathode) in an electrolysis cell that split water molecules producing hydrogen atoms that were attracted to the steel. After loading the steel with hydrogen in the cell, we measured the rate of release of the hydrogen from the steel over two minutes by monitoring the drop in current in the cell, using a technique called potentiostatic discharge.  We used our measurements to calibrate a model of hydrogen release rate, based on Fick’s second law of diffusion, which relates the rate of hydrogen motion (diffusion) to the surface area perpendicular to the motion and the concentration gradient in the direction of motion.  Finally, we used our calibrated model to predict the release rate of hydrogen over 24 hours and checked our predictions using a second measurement based on the hydrogen released when the steel was melted.  So, now we have a method of predicting the amount of hydrogen in a steel remaining in a sample many hours after exposure during electrolysis without destroying the test sample.  This will allow us to perform better defined tests on the influence of hydrogen on the performance of stainless steel in the extreme environments of fission and fusion reactors.

Source:

Weihrauch M, Patel M, Patterson EA. Measurements and predictions of diffusible hydrogen escape and absorption in cathodically charged 316LN austenitic stainless steel. Scientific Reports. 13(1):10545, 2023.

Image:

Figure 2a from Weihrauch et al , 2023 showing electrolysis cell setup for potentiostatic discharge experiments.