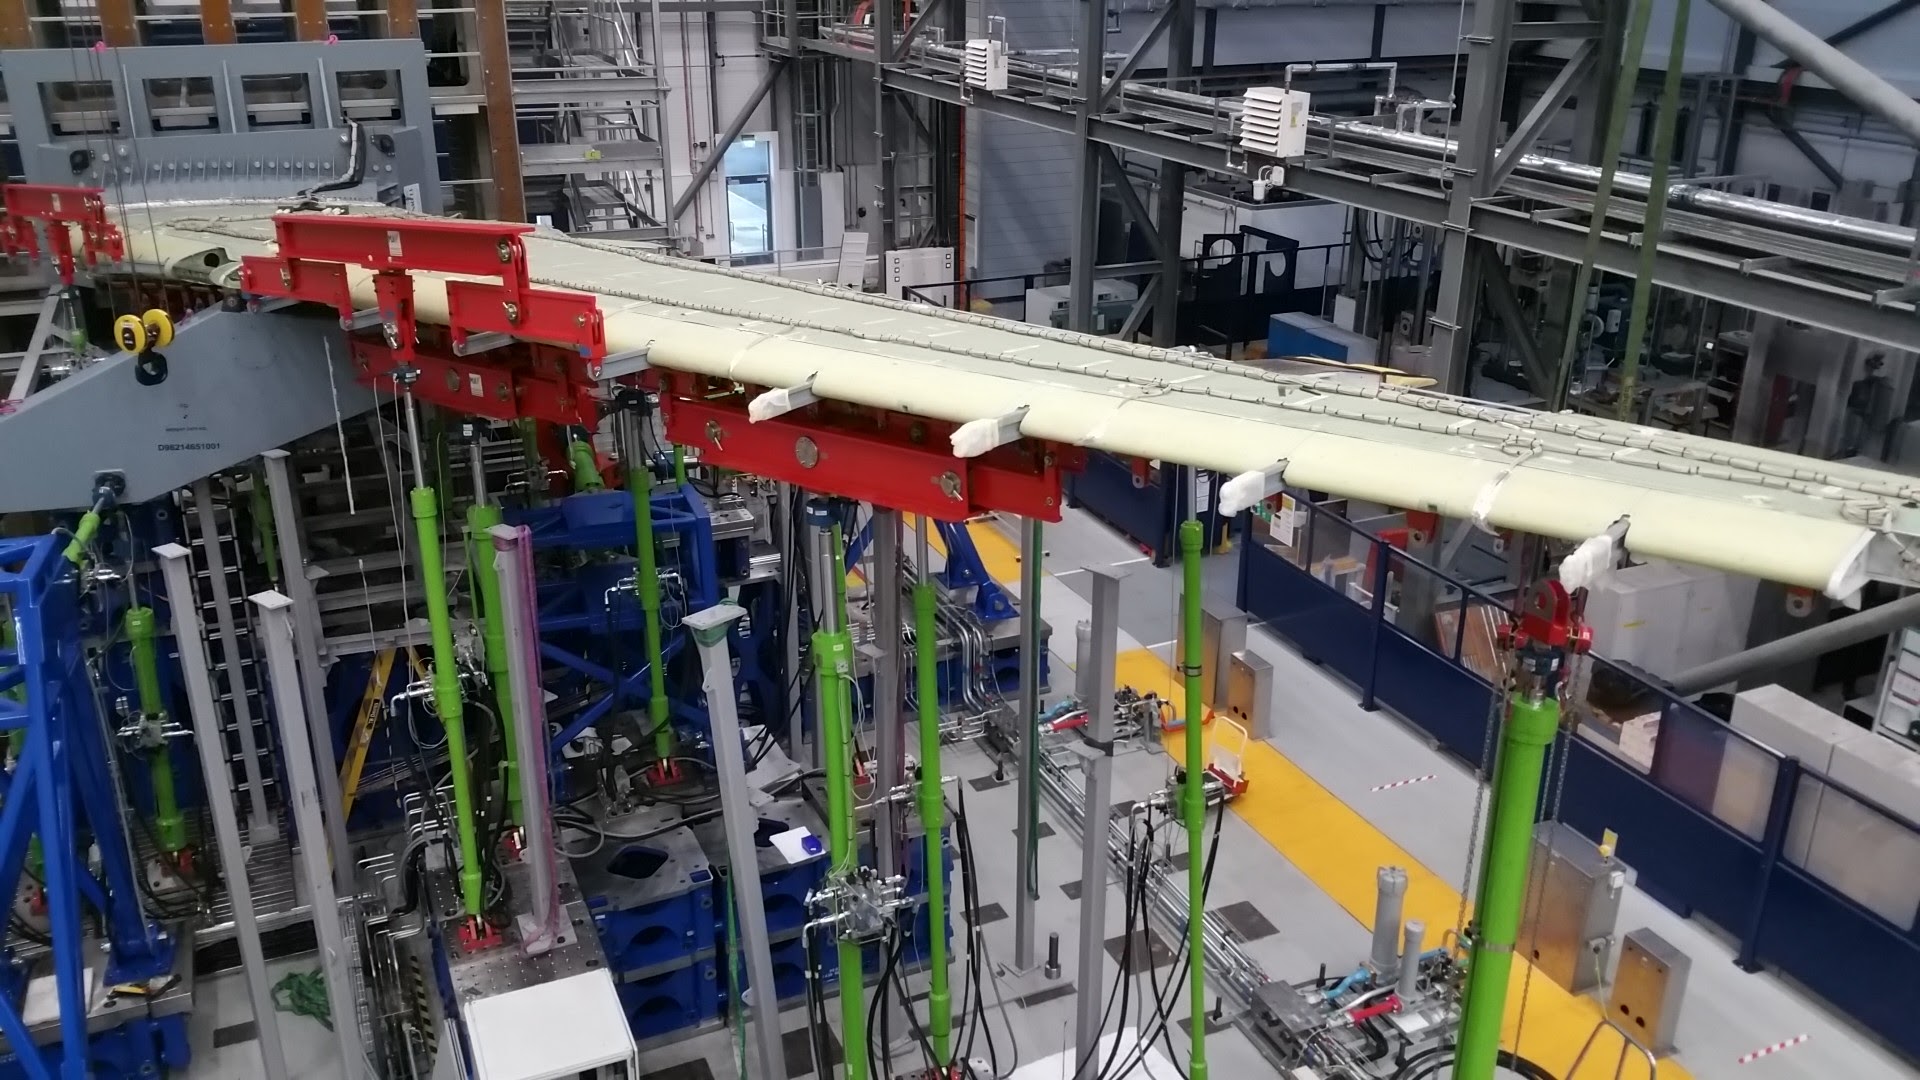
Tag Archives: damage

Seeing small changes is a big achievement

Figure 8 from Amjad et al 2022Some years ago I wrote with great excitement about publishing a paper in Royal Society Open Science [see ‘Press release!‘ on November 15th, 2017].  This has become a routine event; however, the excitement returned earlier this month when we had a paper published in the Proceedings of Royal Society of London on ‘A thermal emissions-based real-time monitoring system for in situ detection of cracks’.  The Proceedings were first published in February 1831 and this is only the second time in my career that my group has published a paper in them.  The last time was ten years ago and was also about cracks: ‘Quantitative measurement of plastic strain field at a fatigue crack tip’.  I have already described this earlier work in a post [see ‘Scattering electrons reveal dislocations in material structure’ on November 11th, 2020].  This was the first time that the size and shape of the plastic zone around a crack had been measured directly rather than inferred from other measurements.  It required an expensive scanning electron microscope and a well-equipped laboratory.  In contrast, the work in the paper published this month uses components that can be purchased for the price of a smart phone and assembled into a device not much larger than a smart phone.  The device detects the changes in the temperature distribution over the surface of the metal caused by the propagation of a crack due to repeated loading of the metal.  It is based on the principles of thermoelastic stress analysis [see ‘Counting photons to measure stress‘ on November 18th, 2015], which is a well-established measurement technique that usually requires expensive infra-red cameras.  Our key innovation is to not aim for absolute measurement values, which allows us to ignore calibration requirements, and instead to look for changes in the temperature distribution on the metal surface by extracting feature vectors from the images [see ‘Recognising strain‘ on October 28th 2015].  Our approach lowers the cost of the equipment required by several orders of magnitude, achieves comparable or better resolution of crack growth (around 1 mm) and will function at lower loading frequencies than techniques based on classical thermoelastic stress analysis.  Besides crack analysis, the common theme of the two papers is the innovative use of image processing to identify change, based on the fracture mechanics of crack propagation.

The research reported in this month’s paper was largely performed as part of the DIMES project about which I have written many posts.

The University of Liverpool was the coordinator of the DIMES project and the other partners were Empa, Dantec Dynamics GmbH and Strain Solutions Ltd.  Airbus was the topic manager on behalf of the Clean Sky 2 Joint Undertaking.

Logos of Clean Sky 2 and EUThe DIMES project received funding from the Clean Sky 2 Joint Undertaking under the European Union’s Horizon 2020 research and innovation programme under grant agreement No. 820951.

The opinions expressed in this blog post reflect only the author’s view and the Clean Sky 2 Joint Undertaking is not responsible for any use that may be made of the information it contains.

References:

Amjad, K., Lambert, C.A., Middleton, C.A., Greene, R.J., Patterson, E.A., 2022, A thermal emissions-based real-time monitoring system for in situ detection of cracks, Proc. R. Soc. A., doi: 10.1098/rspa.2021.0796.

Yang, Y., Crimp, M., Tomlinson, R.A., Patterson, E.A., 2012, Quantitative measurement of plastic strain field at a fatigue crack tip, Proc. R. Soc. A., 468(2144):2399-2415.

Image: Figure 8 from Amjad et al, 2022, Proc. R. Soc. A., doi: 10.1098/rspa.2021.0796.

Nudging discoveries along the innovation path

Decorative photograph of a Welsh hillThe path from a discovery to a successful innovation is often tortuous and many good ideas fall by the wayside.  I have periodically reported on progress along the path for our novel technique for extracting feature vectors from maps of strain data [see ‘Recognizing strain‘ on October 28th, 2015] and its application to validating models of structures by comparing predicted and measured data [see ‘Million to one‘ on November 21st, 2018], and to tracking damage in composite materials [see ‘Spatio-temporal damage maps‘ on May 6th, 2020] as well as in metallic aircraft structures [see ‘Out of the valley of death into a hype cycle‘ on February 24th 2021].  As industrial case studies, we have deployed the technology for validation of predictions of structural behaviour of a prototype aircraft cockpit [see ‘The blind leading the blind‘ on May 27th, 2020] as part of the MOTIVATE project and for damage detection during a wing test as part of the DIMES project.  As a result of the experience gained in these case studies, we recently published an enhanced version of our technique for extracting feature vectors that allows us to handle data from irregularly shaped objects or data sets with gaps in them [Christian et al, 2021].  Now, as part of the Smarter Testing project [see ‘Jigsaw puzzling without a picture‘ on October 27th, 2021] and in collaboration with Dassault Systemes, we have developed a web-based widget that implements the enhanced technique for extracting feature vectors and compares datasets from computational models and physical models.  The THEON web-based widget is available together with a video demonstration of its use and a user manual.  We supplied some exemplar datasets based on our work in structural mechanics as supplementary material associated with our publication; however, it is applicable across a wide range of fields including earth sciences, as we demonstrated in our recent work on El Niño events [see ‘From strain measurements to assessing El Niño events‘ on March 17th, 2021].  We feel that we have taken some significant steps along the innovation path which will lead to adoption of our technique by a wider community; but only time will tell whether this technology survives or falls by the wayside despite our efforts to keep it on track.

Bibliography

Christian WJR, Dvurecenska K, Amjad K, Pierce J, Przybyla C & Patterson EA, Real-time quantification of damage in structural materials during mechanical testing, Royal Society Open Science, 7:191407, 2020.

Christian WJ, Dean AD, Dvurecenska K, Middleton CA, Patterson EA. Comparing full-field data from structural components with complicated geometries. Royal Society open science. 8(9):210916, 2021

Dvurecenska K, Graham S, Patelli E & Patterson EA, A probabilistic metric for the validation of computational models, Royal Society Open Science, 5:1180687, 2018.

Middleton CA, Weihrauch M, Christian WJR, Greene RJ & Patterson EA, Detection and tracking of cracks based on thermoelastic stress analysis, R. Soc. Open Sci. 7:200823, 2020.

Wang W, Mottershead JE, Patki A, Patterson EA, Construction of shape features for the representation of full-field displacement/strain data, Applied Mechanics and Materials, 24-25:365-370, 2010.

Our last DIMES

Photograph of wing test in AWICThirty-three months ago (see ‘Finding DIMES‘ on February 6th, 2019) we set off at a gallop ‘to develop and demonstrate an automated measurement system that integrates a range of measurement approaches to enable damage and cracks to be detected and monitored as they originate at multi-material interfaces in an aircraft assembly’. The quotation is taken directly from the aim of the DIMES project which was originally planned and funded as a two-year research programme. Our research, in particular the demonstration element, has been slowed down by the pandemic and we resorted to two no-cost extensions, initially for three months and then for six months to achieve the project aim.   Two weeks ago, we held our final review meeting, and this week we will present our latest results in the third of a series of annual workshops hosted by Airbus, the project’s topic manager.   The DIMES system combines visual and infrared cameras with resistance strain gauges and fibre Bragg gratings to detect 1 mm cracks in metals and damage indications in composites that are only 6 mm in diameter.  We had a concept design by April 2019 (see ‘Joining the dots‘ on July 10th, 2019) and a detailed design by August 2019.  Airbus supplied us with a section of A320 wing, and we built a test-bench at Empa in Zurich in which we installed our prototype measurement system in the last quarter of 2019 (see ‘When seeing nothing is a success‘ on December 11th, 2019).  Then, the pandemic intervened and we did not finish testing until May 2021 by which time, we had also evaluated it for monitoring damage in composite A350 fuselage panels (see ‘Noisy progressive failure of a composite panel‘ on June 30th, 2021).  In parallel, we have installed our ‘DIMES system’ in ground tests on an aircraft wing at Airbus in Filton (see image) and, using a remote installation, in a cockpit at Airbus in Toulouse (see ‘Most valued player performs remote installation‘ on December 2nd, 2020), as well as an aircraft at NRC Aerospace in Ottawa (see ‘An upside to lockdown‘ on April 14th 2021).   Our innovative technology allows condition-led monitoring based on automated damage detection and enables ground tests on aircraft structures to be run 24/7 saving about 3 months on each year-long test.

The University of Liverpool is the coordinator of the DIMES project and the other partners are Empa, Dantec Dynamics GmbH and Strain Solutions Ltd.

The DIMES project has received funding from the Clean Sky 2 Joint Undertaking under the European Union’s Horizon 2020 research and innovation programme under grant agreement No. 820951.

The opinions expressed in this blog post reflect only the author’s view and the Clean Sky 2 Joint Undertaking is not responsible for any use that may be made of the information it contains.

Out of the valley of death into a hype cycle?

Fig 5 from Middleton et al with full captionThe capability to identify damage and track its propagation in structures is important in ensuring the safe operation of a wide variety of engineering infrastructure, including aircraft structures. A few years ago, I wrote about research my group was performing, in the INSTRUCTIVE project [see ‘INSTRUCTIVE final reckoning‘ on January 9th, 2019] with Airbus and Strain Solutions Limited, to deliver a new tool for monitoring the development of damage using thermoelastic stress analysis (TSA) [see ‘Counting photons to measure stress‘ on November 18th, 2015].  We collected images using a TSA system while a structural component was subject to cycles of load that caused damage to initiate and propagate during a fatigue test. The series of images were analysed using a technique based on optical flow to identify apparent movement between the images which was taken as indication of the development of damage [1]. We demonstrated that our technique could indicate the presence of a crack less than a millimetre in length and even identify cracks initiating under the heads of bolts using experiments performed in our laboratory [see ‘INSTRUCTIVE update‘ on October 4th, 2017].  However, this technique was susceptible to errors in the images when we tried to use low-cost sensors and to changes in the images caused by flight cycle loading with varying amplitude and frequency of loads.  Essentially, the optical flow approach could be fooled into identifying damage propagation when a sensor delivered a noisy image or the shape of the load cycle was changed.  We have now overcome this short-coming by replacing the optical flow approach with the orthogonal decomposition technique [see ‘Recognising strain‘ on October 28th, 2015] that we developed for comparing data fields from measurements and predictions in validation processes [see ‘Million to one‘ on November 21st, 2018] .  Each image is decomposed to a feature vector and differences between the feature vectors are indicative of damage development (see schematic in thumbnail from [2]).  The new technique, which we have named the differential feature vector method, is sufficiently robust that we have been able to use a sensor costing 1% of the price of a typical TSA system to identify and track cracks during cyclic loading.  The underpinning research was published in December 2020 by the Royal Society [2] and the technique is being implemented in full-scale ground-tests on aircraft structures as part of the DIMES project.  Once again, a piece of technology is emerging from the valley of death [see ‘Slowly crossing the valley of death‘ on January 27th, 2021] and, without wishing to initiate the hype cycle [see ‘Hype cycle‘ on September 23rd, 2015], I hope it will transform the use of thermal imaging for condition monitoring.

Logos of Clean Sky 2 and EUThe INSTRUCTIVE and DIMES projects have received funding from the Clean Sky 2 Joint Undertaking under the European Union’s Horizon 2020 research and innovation programme under grant agreements No. 685777 and No. 820951 respectively.

The opinions expressed in this blog post reflect only the author’s view and the Clean Sky 2 Joint Undertaking is not responsible for any use that may be made of the information it contains.

References

[1] Middleton CA, Gaio A, Greene RJ & Patterson EA, Towards automated tracking of initiation and propagation of cracks in Aluminium alloy coupons using thermoelastic stress analysis, J. Non-destructive Testing, 38:18, 2019.

[2] Middleton CA, Weihrauch M, Christian WJR, Greene RJ & Patterson EA, Detection and tracking of cracks based on thermoelastic stress analysis, R. Soc. Open Sci. 7:200823, 2020.