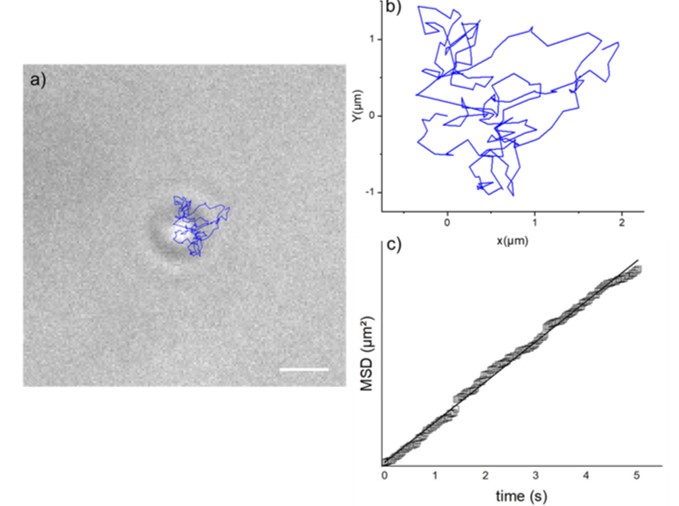
(a) Two-dimensional random dynamics (blue line) of a pelp20 bacteriophage monitored for a period of 5 s. Scale bar, 2 µm. (b) A plot of the same dynamics and (c) the mean square displacement (MSD) of the random walk. The MSD of the random walk is represented by square data points, and a linear fit (black line) has been applied to the data (Figure 4 from https://royalsocietypublishing.org/view-large/figure/20098614/rsif.2026.0250.f004.tif)
I was excited last month when our latest research on tracking nano-entities was published by the Journal of the Royal Society Interface. The paper describes the real-time and label-free tracking of bacteriophages, or phages, in an optical microscope using caustics (see right thumbnail). Phages are of interest due to the potential applications in biotechnology and medicine. They selectively infect and replicate within bacteria and play an important role in regulating bacterial populations across many ecosystems. I have written previously about the threat of antimicrobial resistant (AMR) infections and our research on the real-time tracking of individual bacterium that could be responsible for such infections [see ‘Label-free real-time tracking of individual bacterium‘ on January 25th, 2023]. In this newly published paper, we describe tracking phages as they interact with and compromise bacteria (see bottom thumbnail) using the same technique, optical caustics [see ‘Caustics‘ on October 15th, 2024 and application to ‘Nanoparticle motion through heterogeneous hydrogels‘ on November 6th, 2024 and to ‘Corona-induced transition from molecular to particle motion in biological media‘ on December 4th, 2024]. Traditionally, phages have been monitored using fluorescent labelling because their size is nanometric which renders them invisible in a conventional optical microscope. However, chemically attaching labels to nano entities has been shown to influence their dynamics. Hence, this new study represents a significant advance that will accelerate the real-time observation of phage-bacteria interactions which will enable the development of phage-based diagnostics and antimicrobial therapies.
Sources:
Francesco GiorgiSamuel CheneryLiberty DuignanJoanne L. FothergillEann PattersonJudith M. Curran; Elucidating bacteriophage dynamics and interactions with real-time label-free optical imaging. J R Soc Interface 1 May 2026; 23 (238): 20260250. https://doi.org/10.1098/rsif.2026.0250
![Details of E. coli bacteria: (a) not exposed (reprinted from [17]) and (b,c) exposed to a population of EcoLiv25 phages in solution. In (b), the arrow points at the supposed presence of a phage attached to the bacterium’s external membrane, while in (c), the arrows point at the compromised sections of the bacterium’s external membrane as a result of phage infection. Scale bars, 2 µm.](https://realizeengineering.blog/wp-content/uploads/2026/05/figure-6-rsif.jpg)
Details of E. coli bacteria: (a) not exposed and (b,c) exposed to a population of EcoLiv25 phages in solution. In (b), the arrow points at the supposed presence of a phage attached to the bacterium’s external membrane, while in (c), the arrows point at the compromised sections of the bacterium’s external membrane as a result of phage infection. Scale bars, 2 µm (Figure 6 from https://royalsocietypublishing.org/view-large/figure/20098622/rsif.2026.0250.f006.tif).


