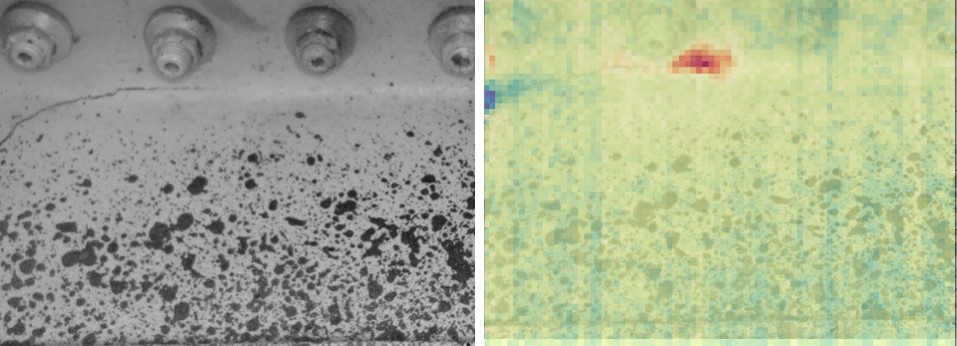
The capability to identify damage and track its propagation in structures is important in ensuring the safe operation of a wide variety of engineering infrastructure, including aircraft structures. A few years ago, I wrote about research my group was performing, in the INSTRUCTIVE project [see ‘INSTRUCTIVE final reckoning‘ on January 9th, 2019] with Airbus and Strain Solutions Limited, to deliver a new tool for monitoring the development of damage using thermoelastic stress analysis (TSA) [see ‘Counting photons to measure stress‘ on November 18th, 2015]. We collected images using a TSA system while a structural component was subject to cycles of load that caused damage to initiate and propagate during a fatigue test. The series of images were analysed using a technique based on optical flow to identify apparent movement between the images which was taken as indication of the development of damage [1]. We demonstrated that our technique could indicate the presence of a crack less than a millimetre in length and even identify cracks initiating under the heads of bolts using experiments performed in our laboratory [see ‘INSTRUCTIVE update‘ on October 4th, 2017]. However, this technique was susceptible to errors in the images when we tried to use low-cost sensors and to changes in the images caused by flight cycle loading with varying amplitude and frequency of loads. Essentially, the optical flow approach could be fooled into identifying damage propagation when a sensor delivered a noisy image or the shape of the load cycle was changed. We have now overcome this short-coming by replacing the optical flow approach with the orthogonal decomposition technique [see ‘Recognising strain‘ on October 28th, 2015] that we developed for comparing data fields from measurements and predictions in validation processes [see ‘Million to one‘ on November 21st, 2018] . Each image is decomposed to a feature vector and differences between the feature vectors are indicative of damage development (see schematic in thumbnail from [2]). The new technique, which we have named the differential feature vector method, is sufficiently robust that we have been able to use a sensor costing 1% of the price of a typical TSA system to identify and track cracks during cyclic loading. The underpinning research was published in December 2020 by the Royal Society [2] and the technique is being implemented in full-scale ground-tests on aircraft structures as part of the DIMES project. Once again, a piece of technology is emerging from the valley of death [see ‘Slowly crossing the valley of death‘ on January 27th, 2021] and, without wishing to initiate the hype cycle [see ‘Hype cycle‘ on September 23rd, 2015], I hope it will transform the use of thermal imaging for condition monitoring.
 The INSTRUCTIVE and DIMES projects have received funding from the Clean Sky 2 Joint Undertaking under the European Union’s Horizon 2020 research and innovation programme under grant agreements No. 685777 and No. 820951 respectively.
The opinions expressed in this blog post reflect only the author’s view and the Clean Sky 2 Joint Undertaking is not responsible for any use that may be made of the information it contains.
References
[1] Middleton CA, Gaio A, Greene RJ & Patterson EA, Towards automated tracking of initiation and propagation of cracks in Aluminium alloy coupons using thermoelastic stress analysis, J. Non-destructive Testing, 38:18, 2019.
[2] Middleton CA, Weihrauch M, Christian WJR, Greene RJ & Patterson EA, Detection and tracking of cracks based on thermoelastic stress analysis, R. Soc. Open Sci. 7:200823, 2020.