Tag Archives: strain

Nudging discoveries along the innovation path

Decorative photograph of a Welsh hillThe path from a discovery to a successful innovation is often tortuous and many good ideas fall by the wayside.  I have periodically reported on progress along the path for our novel technique for extracting feature vectors from maps of strain data [see ‘Recognizing strain‘ on October 28th, 2015] and its application to validating models of structures by comparing predicted and measured data [see ‘Million to one‘ on November 21st, 2018], and to tracking damage in composite materials [see ‘Spatio-temporal damage maps‘ on May 6th, 2020] as well as in metallic aircraft structures [see ‘Out of the valley of death into a hype cycle‘ on February 24th 2021].  As industrial case studies, we have deployed the technology for validation of predictions of structural behaviour of a prototype aircraft cockpit [see ‘The blind leading the blind‘ on May 27th, 2020] as part of the MOTIVATE project and for damage detection during a wing test as part of the DIMES project.  As a result of the experience gained in these case studies, we recently published an enhanced version of our technique for extracting feature vectors that allows us to handle data from irregularly shaped objects or data sets with gaps in them [Christian et al, 2021].  Now, as part of the Smarter Testing project [see ‘Jigsaw puzzling without a picture‘ on October 27th, 2021] and in collaboration with Dassault Systemes, we have developed a web-based widget that implements the enhanced technique for extracting feature vectors and compares datasets from computational models and physical models.  The THEON web-based widget is available together with a video demonstration of its use and a user manual.  We supplied some exemplar datasets based on our work in structural mechanics as supplementary material associated with our publication; however, it is applicable across a wide range of fields including earth sciences, as we demonstrated in our recent work on El Niño events [see ‘From strain measurements to assessing El Niño events‘ on March 17th, 2021].  We feel that we have taken some significant steps along the innovation path which will lead to adoption of our technique by a wider community; but only time will tell whether this technology survives or falls by the wayside despite our efforts to keep it on track.

Bibliography

Christian WJR, Dvurecenska K, Amjad K, Pierce J, Przybyla C & Patterson EA, Real-time quantification of damage in structural materials during mechanical testing, Royal Society Open Science, 7:191407, 2020.

Christian WJ, Dean AD, Dvurecenska K, Middleton CA, Patterson EA. Comparing full-field data from structural components with complicated geometries. Royal Society open science. 8(9):210916, 2021

Dvurecenska K, Graham S, Patelli E & Patterson EA, A probabilistic metric for the validation of computational models, Royal Society Open Science, 5:1180687, 2018.

Middleton CA, Weihrauch M, Christian WJR, Greene RJ & Patterson EA, Detection and tracking of cracks based on thermoelastic stress analysis, R. Soc. Open Sci. 7:200823, 2020.

Wang W, Mottershead JE, Patki A, Patterson EA, Construction of shape features for the representation of full-field displacement/strain data, Applied Mechanics and Materials, 24-25:365-370, 2010.

Diving into three-dimensional fluids

My research group has been working for some years on methods that allow straightforward comparison of large datasets [see ‘Recognizing strain’ on October 28th 2015].  Our original motivation was to compare maps of predicted strain over the surface of engineering structures with maps of measurements.  We have used these comparison methods to validate predictions produced by computational models [see ‘Million to one’ on November 21st 2018] and to identify and track changes in the condition of engineering structures [see ‘Out of the valley of death into a hype cycle’ on February 24th 2021].  Recently, we have extended this second application to tracking changes in the environment including the occurance of El Niño events [see ‘From strain measurements to assessing El Niño events’ on March 17th, 2021].  Now, we are hoping to extend this research into fluid mechanics by using our techniques to compare flow patterns.  We have had some success in exploring the use of methods to optimise the design of the mesh of elements used in computational fluid dynamics to model some simple flow regimes.  We are looking for a PhD student to work on extending our model validation techniques into fluid mechanics using volumes of data from measurement and predictions rather than fields, i.e., moving from two-dimensional to three-dimensional datasets.  If you are interested or know someone who might be interested then please get in touch.

There is more information on the PhD project here.

Jigsaw puzzling without a picture

A350 XWB passes Maximum Wing Bending test

A350 XWB passes Maximum Wing Bending test

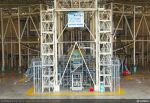
Research sometimes feels like putting together a jigsaw puzzle without the picture or being sure you have all of the pieces.  The pieces we are trying to fit together at the moment are (i) image decomposition of strain fields [see ‘Recognising strain’ on October 28th 2015] that allows fields containing millions of data values to be represented by a feature vector with only tens of elements which is useful for comparing maps or fields of predictions from a computational model with measurements made in the real-world; (ii) evaluation of the variation in measurement uncertainty over a field of view of measured displacements or strains in a large structure [see ‘Industrial uncertainty’ on December 12th 2018] which provides information about the quality of the measurements; and (iii) a probabilistic validation metric that provides a measure of how well predictions from a computational model represent measurements made in the real world [see ‘Million to one’ on November 21st 2018].  We have found some of the missing pieces of the jigsaw, for example we have established how to represent the distribution of measurement uncertainty in the feature vector domain [see ‘From strain measurements to assessing El Niño events’ on March 17th 2021] so that it can be used to assess the significance of differences between measurements and predictions represented by their feature vectors – this connects (i) and (ii) together.  Very recently we have demonstrated a generic technique for performing image decomposition of irregularly shaped fields of data or data fields with holes [see Christian et al, 2021] which extends the applicability of our method for comparing measurements and predictions to real-world objects rather than idealised shapes.  This allows (i) to be used in industrial applications but we still have to work out how to connect this to the probabilistic metric in (iii) while also incorporating spatially-varying uncertainty.  These techniques can be used in a wide range of applications, as demonstrated in our recent work on El Niño events [see Alexiadis et al, 2021], because, by treating all fields of data as images, the techniques are agnostic about the source and format of the data.  However, at the moment, our main focus is on their application to ground tests on aircraft structures as part of the Smarter Testing project in collaboration with Airbus, Centre for Modelling & Simulation, Dassault Systèmes, GOM UK Ltd, and the National Physical Laboratory with funding from the Aerospace Technology Institute.  Together we are working towards digital continuity across virtual and physical testing of aircraft structures to provide live data fusion and enable condition-led inspections, test control and validation of computational models.  We anticipate these advances will reduce time and costs for physical tests and accelerate the development of new designs of aircraft that will contribute to global sustainability targets (the aerospace industry has committed to reduce CO2 emissions to 50% of 2005 levels by 2050).  The Smarter Testing project has an ambitious goal which reveals that our pieces of the jigsaw puzzle belong to a small section of a much larger one.

For more on the Smarter Testing project see:

https://www.aerospacetestinginternational.com/news/structural-testing/smarter-testing-research-program-to-link-virtual-and-physical-aerospace-testing.html

https://www.aerospacetestinginternational.com/opinion/how-integrating-the-virtual-and-physical-will-make-aerospace-testing-and-certification-smarter.html

References

Alexiadis A, Ferson S, Patterson EA. Transformation of measurement uncertainties into low-dimensional feature vector space. Royal Society open science. 8(3):201086, 2021.

Christian WJ, Dean AD, Dvurecenska K, Middleton CA, Patterson EA. Comparing full-field data from structural components with complicated geometries. Royal Society open science. 8(9):210916, 2021.

Image: http://www.airbus.com/galleries/photo-gallery

If you don’t succeed, try and try again…

Photograph of S-shaped plateYou would not think it was difficult to build a thin flat metallic plate using a digital description of the plate and a Laser Powder Bed Fusion (L-PBF) machine which can build complex components, such as hip prostheses.  But it is.  As we have discovered since we started our research project on the thermoacoustic response of additively manufactured parts (see ‘Slow start to an exciting new project on thermoacoustic response of AM metals‘ on September 9th, 2020).  L-PBF involves using a laser beam to melt selected regions of a thin layer of metal powder spread over a flat bed.  The selected regions represent a cross-section of the desired three-dimensional component and repeating the process for each successive cross-section results in the additive building of the component as each layer solidifies.  And there in those last four words lies the problem because ‘as each layer solidifies’ the temperature distribution between the layers causes different levels of thermal expansion that results in strains being locked into our thin plates.  Our plates are too thin to build with their plane surfaces horizontal or perpendicular to the laser beam so instead we build them with their plane surface parallel to the laser beam, or vertical like a street sign.  In our early attempts, the residual stresses induced by the locked-in strains caused the plate to buckle into an S-shape before it was complete (see image).  We solved this problem by building buttresses at the edges of the plate.  However, when we remove the buttresses and detach the plate from the build platform, it buckles into a dome-shape.  Actually, you can press the centre of the plate and make it snap back and forth noisily.  While we are making progress in understanding the mechanisms at work, we have some way to go before we can confidently produce flat plates using additive manufacturing that we can use in comparisons with our earlier work on the performance of conventionally, or subtractively, manufactured plates subject to the thermoacoustic loading experienced by the skin of a hypersonic vehicle [see ‘Potential dynamic buckling in hypersonic vehicle skin‘ on July 1st 2020) or the containment walls in a fusion reactor.  Sometimes research is painfully slow but no one ever talks about it.  Maybe because we quickly forget the painful parts once we have a successful outcome to brag about. But it is often precisely the painful repetitions of “try and try again” that allow us to reach the bragging stage of a successful outcome.

The research is funded jointly by the National Science Foundation (NSF) in the USA and the Engineering and Physical Sciences Research Council (EPSRC) in the UK (see Grants on the Web).

References

Silva AS, Sebastian CM, Lambros J and Patterson EA, 2019. High temperature modal analysis of a non-uniformly heated rectangular plate: Experiments and simulations. J. Sound & Vibration, 443, pp.397-410.

Magana-Carranza R, Sutcliffe CJ, Patterson EA, 2021, The effect of processing parameters and material properties on residual forces induced in Laser Powder Bed Fusion (L-PBF). Additive Manufacturing. 46:102192