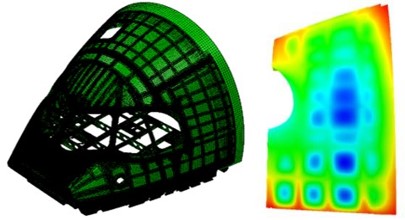
 Three years after it started, the MOTIVATE project has come to an end [see ‘Getting smarter’ on June 21st, 2017]. The focus of the project has been about improving the quality of validation for predictions of structural behaviour in aircraft using fewer, better physical tests. We have developed an enhanced flowchart for model validation [see ‘Spontaneously MOTIVATEd’ on June 27th, 2018], a method for quantifying uncertainty in measurements of deformation in an industrial environment [see ‘Industrial uncertainty’ on December 12th, 2018] and a toolbox for quantifying the extent to which predictions from computational models represent measurements made in the real-world [see ‘Alleviating industrial uncertainty’ on May 13th, 2020]. In the last phase of the project, we demonstrated all of these innovations on the fuselage nose section of an aircraft. The region of interest was the fuselage skin behind the cockpit window for which the out-of-plane displacements resulting from an internal pressurisation load were predicted using a finite element model [see ‘Did cubism inspire engineering analysis?’ on January 25th, 2017]. The computational model was provided by Airbus and is shown on the left in the top graphic with the predictions for the region of interest on the right. We used a stereoscopic imaging system to record images of a speckle pattern on the fuselage before and after pressurization; and from these images, we evaluated the out-of-plane displacements using digital image correlation (DIC) [see ‘256 shades of grey‘ on January 22, 2014 for a brief explanation of DIC]. The bottom graphic shows the measurements being made with assistance from an Airbus contractor, Strain Solutions Limited. We compared the predictions quantitatively against the measurements in a double-blind process which meant that the modellers and experimenters had no access to one another’s results. The predictions were made by one MOTIVATE partner, Athena Research Centre; the measurements were made by another partner, Dantec Dynamics GmbH supported by Strain Solutions Limited; and the quantitative comparison was made by the project coordinator, the University of Liverpool. We found that the level of agreement between the predictions and measurements changed with the level of pressurisation; however, the main outcome was the demonstration that it was possible to perform a double-blind validation process to quantify the extent to which the predictions represented the real-world behaviour for a full-scale aerospace structure.
 The content of this post is taken from a paper that was to be given at a conference later this summer; however, the conference has been postponed due to the pandemic. The details of the paper are: Patterson EA, Diamantakos I, Dvurecenska K, Greene RJ, Hack E, Lampeas G, Lomnitz M & Siebert T, Application of a model validation protocol to an aircraft cockpit panel, submitted to the International Conference on Advances in Experimental Mechanics to be held in Oxford in September 2021. I would like to thank the authors for permission to write about the results in this post and Linden Harris of Airbus SAS for enabling the study and to him and Eszter Szigeti for providing technical advice.
For more on the validation flowchart see: Hack E, Burguete R, Dvurecenska K, Lampeas G, Patterson E, Siebert T & Szigeti, Steps towards industrial validation experiments, In Multidisciplinary Digital Publishing Institute Proceedings (Vol. 2, No. 8, p. 391) https://www.mdpi.com/2504-3900/2/8/391
For more posts on the MOTIVATE project: https://realizeengineering.blog/category/myresearch/motivate-project/
 The MOTIVATE project has received funding from the Clean Sky 2 Joint Undertaking under the European Union’s Horizon 2020 research and innovation programme under grant agreement No. 754660 and the Swiss State Secretariat for Education, Research and Innovation under contract number 17.00064.
The opinions expressed in this blog post reflect only the author’s view and the Clean Sky 2 Joint Undertaking is not responsible for any use that may be made of the information it contains.


