Tag Archives: digital image correlation

Thinking out of the box leads to digital image correlation through space

This is the third in a short series of posts on recent engineering research published by my research group.  Actually, two have already been published: ‘Salt increases nanoparticle diffusion‘ on April 22nd, 2020; and ‘Spatio-temporal damage maps for composite materials‘ on May 6th, 2020 and then I got distracted.  This third one arose from the same project as the time-damage maps which was sponsored by the United States Air Force.  The time-damage maps allow us to explore the evolution of failure in complex materials; however, we already know that damage tends to initiate from imperfections or flaws in the microstructure in the material.  New continuous fibre reinforced composite (CFRC) materials based on ceramics are very sensitive to defects or anomalies in their microstructure, such as misalignment of fibres.  However, they are capable of withstanding temperatures in excess of 1500 degrees Centigrade, which offers the opportunity to use them in jet engines or nuclear power plants to help generate energy more efficiently.  Therefore, it is worthwhile investigating effective methods of inspecting their microstructure which we can do either destructively by repetitively polishing away the surface of a sample and viewing it in a microscope, or non-destructively using x-ray tomography.  In both cases, the result is hundreds of ‘images’ containing millions of data values from which it is challenging to extract useful information.  In our work, we have used a little lateral thinking, to show how digital image correlation, usually used to track deformation of structures using multiple images collected over time [see ‘256 shades of grey‘ on January 22nd, 2014] , can be used to track fibres through the multiple images of the layers of the microstructure.  The result is the sort of ‘stick’ diagram in the image showing the orientation of fibres through the sample.  We have demonstrated that our new algorithm was more reliable and 30 times faster than its nearest rival.

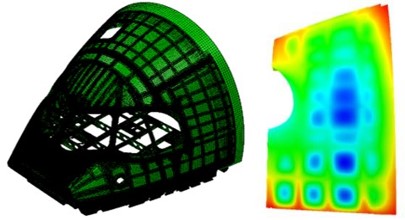
The image shows, at the top, a typical stack of images from the microscope of a ceramic matrix composite; and, at the bottom, a plot of 3d profiles of the fibres tracked using the DIC-based method with the fibres orientated nominally at ±45° from the sectioning (x-y) plane shown in red and green colours.

Source:

Amjad K, Christian WJR, Dvurecenska K, Chapman MG, Uchic MD, Przybyla CP & Patterson EA, Computationally efficient method of tracking fibres in composite materials using digital image correlation, Composites Part A, 129:105683, 2020.


The blind leading the blind

Three years after it started, the MOTIVATE project has come to an end [see ‘Getting smarter’ on June 21st, 2017].  The focus of the project has been about improving the quality of validation for predictions of structural behaviour in aircraft using fewer, better physical tests.  We have developed an enhanced flowchart for model validation [see ‘Spontaneously MOTIVATEd’ on June 27th, 2018], a method for quantifying uncertainty in measurements of deformation in an industrial environment [see ‘Industrial uncertainty’ on December 12th, 2018] and a toolbox for quantifying the extent to which predictions from computational models represent measurements made in the real-world [see ‘Alleviating industrial uncertainty’ on May 13th, 2020].  In the last phase of the project, we demonstrated all of these innovations on the fuselage nose section of an aircraft.  The region of interest was the fuselage skin behind the cockpit window for which the out-of-plane displacements resulting from an internal pressurisation load were predicted using a finite element model [see ‘Did cubism inspire engineering analysis?’ on January 25th, 2017].  The computational model was provided by Airbus and is shown on the left in the top graphic with the predictions for the region of interest on the right.  We used a stereoscopic imaging system  to record images of a speckle pattern on the fuselage before and after pressurization; and from these images, we evaluated the out-of-plane displacements using digital image correlation (DIC) [see ‘256 shades of grey‘ on January 22, 2014 for a brief explanation of DIC].  The bottom graphic shows the measurements being made with assistance from an Airbus contractor, Strain Solutions Limited.  We compared the predictions quantitatively against the measurements in a double-blind process which meant that the modellers and experimenters had no access to one another’s results.  The predictions were made by one MOTIVATE partner, Athena Research Centre; the measurements were made by another partner, Dantec Dynamics GmbH supported by Strain Solutions Limited; and the quantitative comparison was made by the project coordinator, the University of Liverpool.  We found that the level of agreement between the predictions and measurements changed with the level of pressurisation; however, the main outcome was the demonstration that it was possible to perform a double-blind validation process to quantify the extent to which the predictions represented the real-world behaviour for a full-scale aerospace structure.

The content of this post is taken from a paper that was to be given at a conference later this summer; however, the conference has been postponed due to the pandemic.  The details of the paper are: Patterson EA, Diamantakos I, Dvurecenska K, Greene RJ, Hack E, Lampeas G, Lomnitz M & Siebert T, Application of a model validation protocol to an aircraft cockpit panel, submitted to the International Conference on Advances in Experimental Mechanics to be held in Oxford in September 2021.  I would like to thank the authors for permission to write about the results in this post and Linden Harris of Airbus SAS for enabling the study and to him and Eszter Szigeti for providing technical advice.

For more on the validation flowchart see: Hack E, Burguete R, Dvurecenska K, Lampeas G, Patterson E, Siebert T & Szigeti, Steps towards industrial validation experiments, In Multidisciplinary Digital Publishing Institute Proceedings (Vol. 2, No. 8, p. 391) https://www.mdpi.com/2504-3900/2/8/391

For more posts on the MOTIVATE project: https://realizeengineering.blog/category/myresearch/motivate-project/

The MOTIVATE project has received funding from the Clean Sky 2 Joint Undertaking under the European Union’s Horizon 2020 research and innovation programme under grant agreement No. 754660 and the Swiss State Secretariat for Education, Research and Innovation under contract number 17.00064.

The opinions expressed in this blog post reflect only the author’s view and the Clean Sky 2 Joint Undertaking is not responsible for any use that may be made of the information it contains.

Alleviating industrial uncertainty

Want to know how to assess the quality of predictions of structural deformation from a computational model and how to diagnose the causes of differences between measurements and predictions?  The MOTIVATE project has the answers; that might seem like an over-assertive claim but read on and make your own judgment.  Eighteen months ago, I reported on a new method for quantifying the uncertainty present in measurements of deformation made in an industrial environment [see ‘Industrial uncertainty’ on December 12th, 2018] that we were trialling on a 1 m square panel of an aircraft fuselage.  Recently, we have used the measurement uncertainty we found to make judgments about the quality of predictions from computer models of the panel under compressive loading.  The top graphic shows the outside surface of the panel (left) with a speckle pattern to allow measurements of its deformation using digital image correlation (DIC) [see ‘256 shades of grey‘ on January 22, 2014 for a brief explanation of DIC]; and the inside surface (right) with stringers and ribs.  The bottom graphic shows our results for two load cases: a 50 kN compression (top row) and a 50 kN compression and 1 degree of torsion (bottom row).  The left column shows the out-of-plane deformation measured using a stereoscopic DIC system and the middle row shows the corresponding predictions from a computational model using finite element analysis [see ‘Did cubism inspire engineering analysis?’ on January 25th, 2017].  We have described these deformation fields in a reduced form using feature vectors by applying image decomposition [see ‘Recognizing strain’ on October 28th, 2015 for a brief explanation of image decomposition].  The elements of the feature vectors are known as shape descriptors and corresponding pairs of them, from the measurements and predictions, are plotted in the graphs on the right in the bottom graphic for each load case.  If the predictions were in perfect agreement with measurements then all of the points on these graphs would lie on the line equality [y=x] which is the solid line on each graph.  However, perfect agreement is unobtainable because there will always be uncertainty present; so, the question arises, how much deviation from the solid line is acceptable?  One answer is that the deviation should be less than the uncertainty present in the measurements that we evaluated with our new method and is shown by the dashed lines.  Hence, when all of the points fall inside the dashed lines then the predictions are at least as good as the measurements.  If some points lie outside of the dashed lines, then we can look at the form of the corresponding shape descriptors to start diagnosing why we have significant differences between our model and experiment.  The forms of these outlying shape descriptors are shown as insets on the plots.  However, busy, or non-technical decision-makers are often not interested in this level of detailed analysis and instead just want to know how good the predictions are.  To answer this question, we have implemented a validation metric (VM) that we developed [see ‘Million to one’ on November 21st, 2018] which allows us to state the probability that the predictions and measurements are from the same population given the known uncertainty in the measurements – these probabilities are shown in the black boxes superimposed on the graphs.

These novel methods create a toolbox for alleviating uncertainty about predictions of structural behaviour in industrial contexts.  Please get in touch if you want more information in order to test these tools yourself.

The MOTIVATE project has received funding from the Clean Sky 2 Joint Undertaking under the European Union’s Horizon 2020 research and innovation programme under grant agreement No. 754660 and the Swiss State Secretariat for Education, Research and Innovation under contract number 17.00064.

The opinions expressed in this blog post reflect only the author’s view and the Clean Sky 2 Joint Undertaking is not responsible for any use that may be made of the information it contains.