Category Archives: Engineering

Bringing an end to thermodynamic whoopee

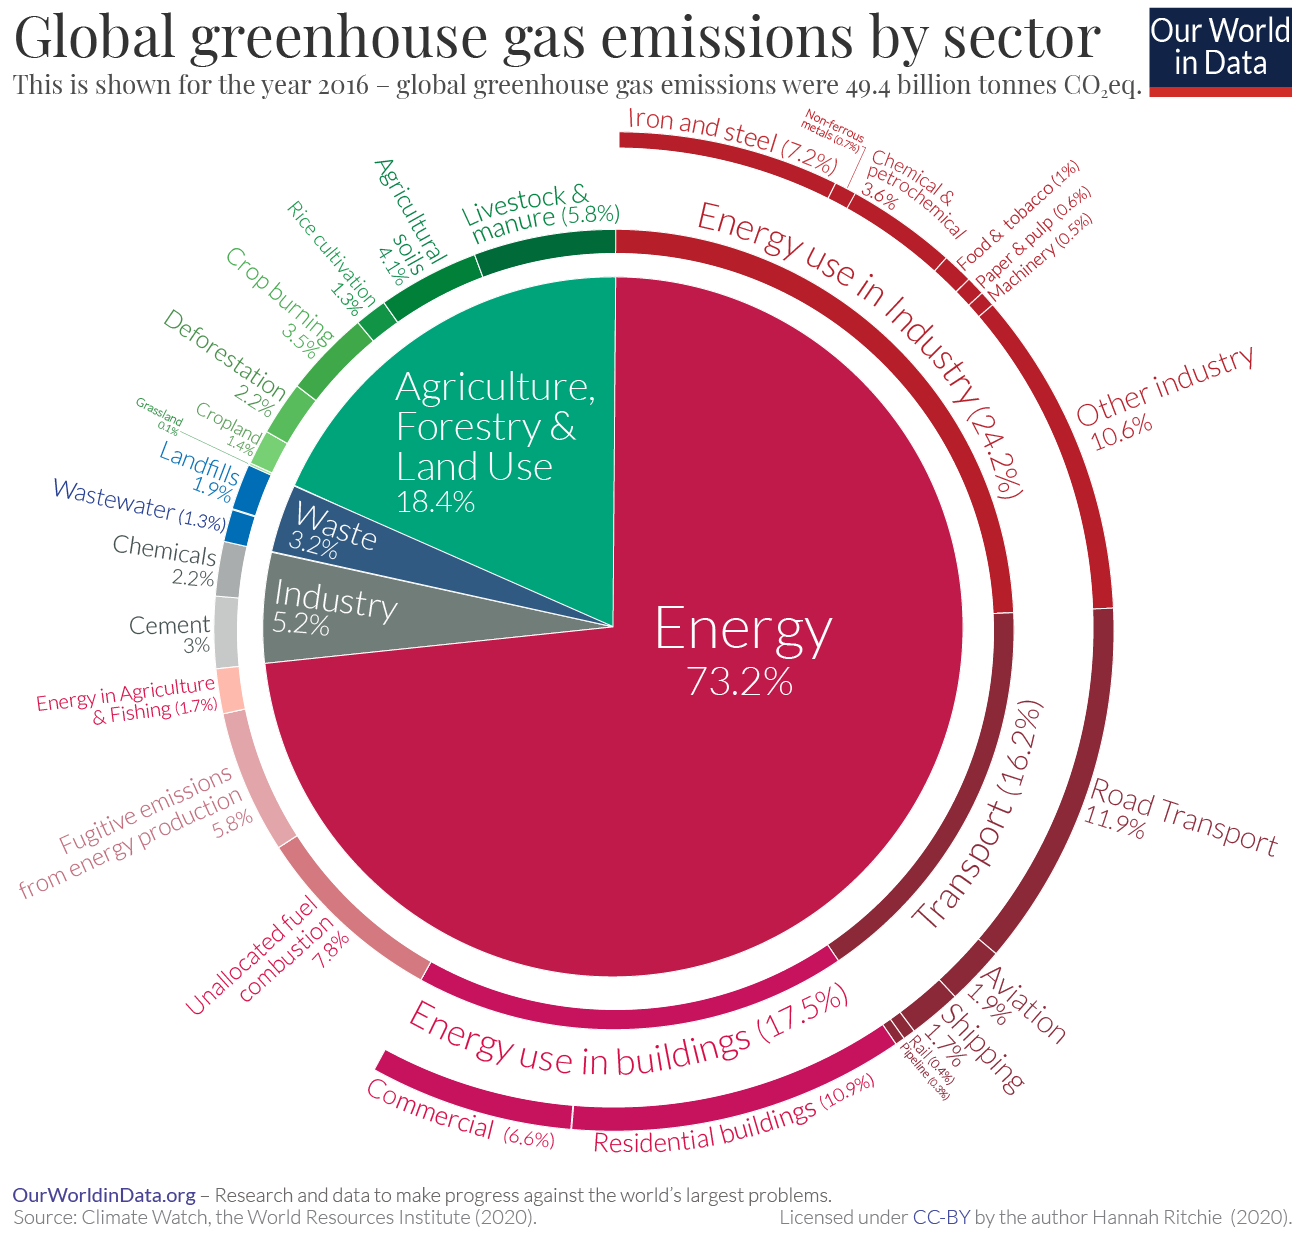
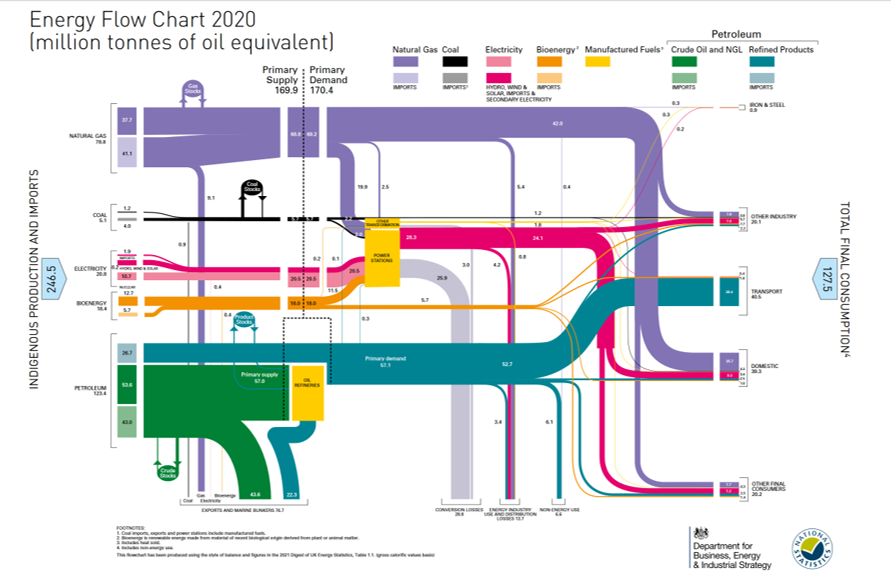
Two weeks ago I used two infographics to illustrate the dominant role of energy use in generating greenhouse gas emissions and the disportionate production of greenhouse gas emission by the rich [see ‘Where we are and what we have‘ on November 24th, 2021].  Energy use is responsible for 73% of global greenhouse gas emissions and 16% of the world’s population are responsible for 38% of global CO2 emissions.  Today’s infographics illustrate the energy flows from source to consumption for the USA (above), UK and Europe (thumbnails below).  In the USA fossil fuels (coal, natural gas and petroleum) are the source of nearly 80% of their energy, in the UK it is a little more than 80% and the chart for Europe is less detailed but the proportion looks similar. COP 26 committed countries to ending ‘support for the international unabated fossil fuel energy sector by the end of 2022’ and recognised ‘investing in unabated fossil-related energy projects increasingly entails both social and economic risks, especially through the form of stranded assets, and has ensuing negative impacts on government revenue, local employment, taxpayers, utility ratepayers and public health.’  However, to reduce our dependency on fossil fuels we need a strategy, a plan of action for a fundamental change in how we power industry, heat our homes and propel our vehicles.  A hydrogen economy requires the production of hydrogen without using fossil fuels, electric cars and electric domestic heating requires our electricity generating capacity to be at least trebled by 2050 in order to hit the net zero target. This scale and speed of  transition to zero-carbon sources is such that it will have to be achieved using an integrated blend of green energy sources, including solar, wind and nuclear energy.  For example, in the UK our current electricity generating capacity is about 76 GW and 1 GW is equivalent to 3.1 million photovoltaic (PV) panels, or 364 utility scale wind turbines [www.energy.gov/eere/articles/how-much-power-1-gigawatt] so trebling capacity from one of these sources alone would imply more than 700 million PV panels, or one wind turbine every square mile.  It is easy to write policies but it is much harder to implement them and make things happen especially when transformational change is required.  We cannot expect things to happen simply because our leaders have signed agreements and made statements.  Now, national plans are required to ween us from our addiction to fossil fuels – it will be difficult but the alternative is that global warming might cause the planet to become uninhabitable for us.  It is time to stop ‘making thermodynamic whoopee with fossil fuels’ to quote Kurt Vonnegut [see ‘And then we discovered thermodynamics‘ on February 3rd, 2016].


Sources:

Kurt Vonnegut, A Man without a Country, New York: Seven Stories Press, 2005.  He wrote ‘we have now all but destroyed this once salubrious planet as a life-support system in fewer than two hundred years, mainly by making thermodynamic whoopee with fossil fuels’.

US Energy flow chart: https://flowcharts.llnl.gov/commodities/energy

EU Energy flow chart: https://ec.europa.eu/eurostat/web/energy/energy-flow-diagrams

UK Energy flow chart: https://www.gov.uk/government/collections/energy-flow-charts#2020

Where we are and what we have

Pie chart showing green house gas emissions by sectorIn his closing statement at COP26 in Glasgow earlier this month, António Guterres, the Secretary-General of the UN stated that ‘Science tells us that the absolute priority must be rapid, deep and sustained emissions reductions in this decade. Specifically – a 45% cut by 2030 compared to 2010 levels.’   About three-quarters of global green house gas emissions are carbon dioxide (30.4 billions tons in 2010 according to the IEA). A reduction in carbon emissions of 45% by 2030 would reduce this to 16.7 billion tons or an average of about 2 tons per person per year (tCO2/person/yr) allowing for the predicted 9% growth in the global population to 8.5 billion people by 2030. This requires the average resident of Asia, Europe and North America to reduce their carbon emissions to about a half, a quarter and a tenth respectively of their current levels (3.8, 7.6 & 17.6 tCO2/person/yr respectively, see the graphic below and ‘Two Earths‘ on August 13th, 2012).  These are massive reductions to achieve in a very short timescale, less than a decade.  Lots of people are talking about global and national targets; however, very few people have any idea at all about how to achieve the massive reductions in emissions being talked about at COP26 and elsewhere.  The graphic above shows global greenhouse gas emissions by sector with almost three-quarters arising from our use of energy to make stuff (energy use in industry: 24%), to move stuff and us (transport: 16%), and to use stuff and keep us comfortable (energy use in building: 17.5%).  Hence, to achieve the target reductions in emissions and prevent the temperature of the planet rising more than 1.5 degrees compared to pre-industrial levels, we need to stop making, buying, moving and consuming stuff.  We need to learn to live with our local climate because cooling and heating buildings consumes energy and heats the planet.  And, we need to use public transport, a bicycle or walk.  By the way, for stuff read all matter, materials, articles, i.e., everything!  We will need to be satisfied with where we are and what we have, to learn to love old but serviceable belongings [see ‘Loving the daily current of existence‘ on August 11th, 2021 and ‘Old is beautiful‘ on May 1st, 2013].

Infographic showing CO2 emission by region and wealth

Follow your gut

Decorative image of a fruit fly nervous system Albert Cardona HHMI Janelia Research Campus Welcome Image Awards 2015Data centres worldwide consume about 1% of global electricity generation, that’s 200-250 TWh (Masenet et al, 2020), and if you add in mining of cryptocurrencies then consumption jumps by about 50% (Gallersdörfer et al, 2020). Data transmission consumes about 260-340 TWh or at least another 1% of global energy consumption (IEA, 2020).  The energy efficiency of modern computers has been improving; however, their consumption is still many millions times greater than the theoretical limit defined by Landauer’s principle which was verified in 2012 by Bérut et al.  According to Landauer’s principle, a computer operating at room temperature would only need 3 zJ (300 billion billionths of a Joule) to erase a bit of information.  The quantity of energy used by modern computers is many millions times the Landauer limit.  Of course, progress is being made almost continuously, for example a team at EPFL in Lausanne and ETH Zurich recently described a new technology that uses only a tenth of the energy of current transistors (Oliva et al 2020).  Perhaps we need turn to biomimetics because Escherichia Coli, which are bacteria that live in our gut and have to process information to reproduce, have been found to use ten thousand times less energy to process a bit of information than the average human-built device for processing information (Zhirnov & Cavin, 2013).  So, E.coli are still some way from the Landauer limit but demonstrate that there is considerable potential for improvement in engineered devices.

References

Bérut A, Arakelyan A, Petrosyan A, Ciliberto S, Dillenschneider R & Lutz E. Experimental verification of Landauer’s principle linking information and thermodynamics. Nature, 483: 187–189, 2012.

IEA (2021), Data Centres and Data Transmission Networks, IEA, Paris https://www.iea.org/reports/data-centres-and-data-transmission-networks

Gallersdörfer U, Klaaßen L, Stoll C. Energy consumption of cryptocurrencies beyond bitcoin. Joule. 4(9):1843-6, 2020.

Masanet E, Shehabi A, Lei N, Smith S, Koomey J. Recalibrating global data center energy-use estimates. Science. 367(6481):984-6, 2020.

Oliva N, Backman J, Capua L, Cavalieri M, Luisier M, Ionescu AM. WSe 2/SnSe 2 vdW heterojunction Tunnel FET with subthermionic characteristic and MOSFET co-integrated on same WSe 2 flake. npj 2D Materials and Applications. 4(1):1-8, 2020.

Zhirnov VV, Cavin RK. Future microsystems for information processing: limits and lessons from the living systems. IEEE Journal of the Electron Devices Society. 1(2):29-47, 2013.

Jigsaw puzzling without a picture

A350 XWB passes Maximum Wing Bending test

A350 XWB passes Maximum Wing Bending test

Research sometimes feels like putting together a jigsaw puzzle without the picture or being sure you have all of the pieces.  The pieces we are trying to fit together at the moment are (i) image decomposition of strain fields [see ‘Recognising strain’ on October 28th 2015] that allows fields containing millions of data values to be represented by a feature vector with only tens of elements which is useful for comparing maps or fields of predictions from a computational model with measurements made in the real-world; (ii) evaluation of the variation in measurement uncertainty over a field of view of measured displacements or strains in a large structure [see ‘Industrial uncertainty’ on December 12th 2018] which provides information about the quality of the measurements; and (iii) a probabilistic validation metric that provides a measure of how well predictions from a computational model represent measurements made in the real world [see ‘Million to one’ on November 21st 2018].  We have found some of the missing pieces of the jigsaw, for example we have established how to represent the distribution of measurement uncertainty in the feature vector domain [see ‘From strain measurements to assessing El Niño events’ on March 17th 2021] so that it can be used to assess the significance of differences between measurements and predictions represented by their feature vectors – this connects (i) and (ii) together.  Very recently we have demonstrated a generic technique for performing image decomposition of irregularly shaped fields of data or data fields with holes [see Christian et al, 2021] which extends the applicability of our method for comparing measurements and predictions to real-world objects rather than idealised shapes.  This allows (i) to be used in industrial applications but we still have to work out how to connect this to the probabilistic metric in (iii) while also incorporating spatially-varying uncertainty.  These techniques can be used in a wide range of applications, as demonstrated in our recent work on El Niño events [see Alexiadis et al, 2021], because, by treating all fields of data as images, the techniques are agnostic about the source and format of the data.  However, at the moment, our main focus is on their application to ground tests on aircraft structures as part of the Smarter Testing project in collaboration with Airbus, Centre for Modelling & Simulation, Dassault Systèmes, GOM UK Ltd, and the National Physical Laboratory with funding from the Aerospace Technology Institute.  Together we are working towards digital continuity across virtual and physical testing of aircraft structures to provide live data fusion and enable condition-led inspections, test control and validation of computational models.  We anticipate these advances will reduce time and costs for physical tests and accelerate the development of new designs of aircraft that will contribute to global sustainability targets (the aerospace industry has committed to reduce CO2 emissions to 50% of 2005 levels by 2050).  The Smarter Testing project has an ambitious goal which reveals that our pieces of the jigsaw puzzle belong to a small section of a much larger one.

For more on the Smarter Testing project see:

https://www.aerospacetestinginternational.com/news/structural-testing/smarter-testing-research-program-to-link-virtual-and-physical-aerospace-testing.html

https://www.aerospacetestinginternational.com/opinion/how-integrating-the-virtual-and-physical-will-make-aerospace-testing-and-certification-smarter.html

References

Alexiadis A, Ferson S, Patterson EA. Transformation of measurement uncertainties into low-dimensional feature vector space. Royal Society open science. 8(3):201086, 2021.

Christian WJ, Dean AD, Dvurecenska K, Middleton CA, Patterson EA. Comparing full-field data from structural components with complicated geometries. Royal Society open science. 8(9):210916, 2021.

Image: http://www.airbus.com/galleries/photo-gallery