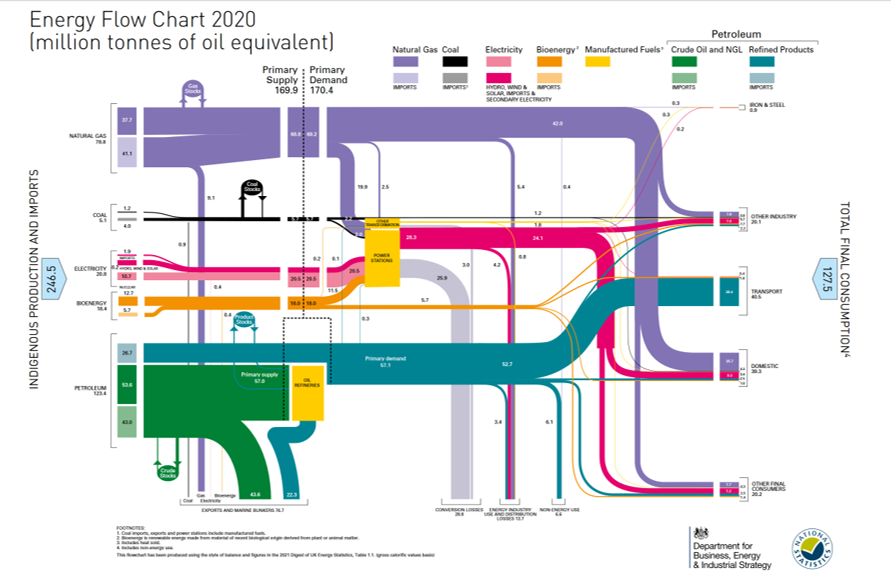
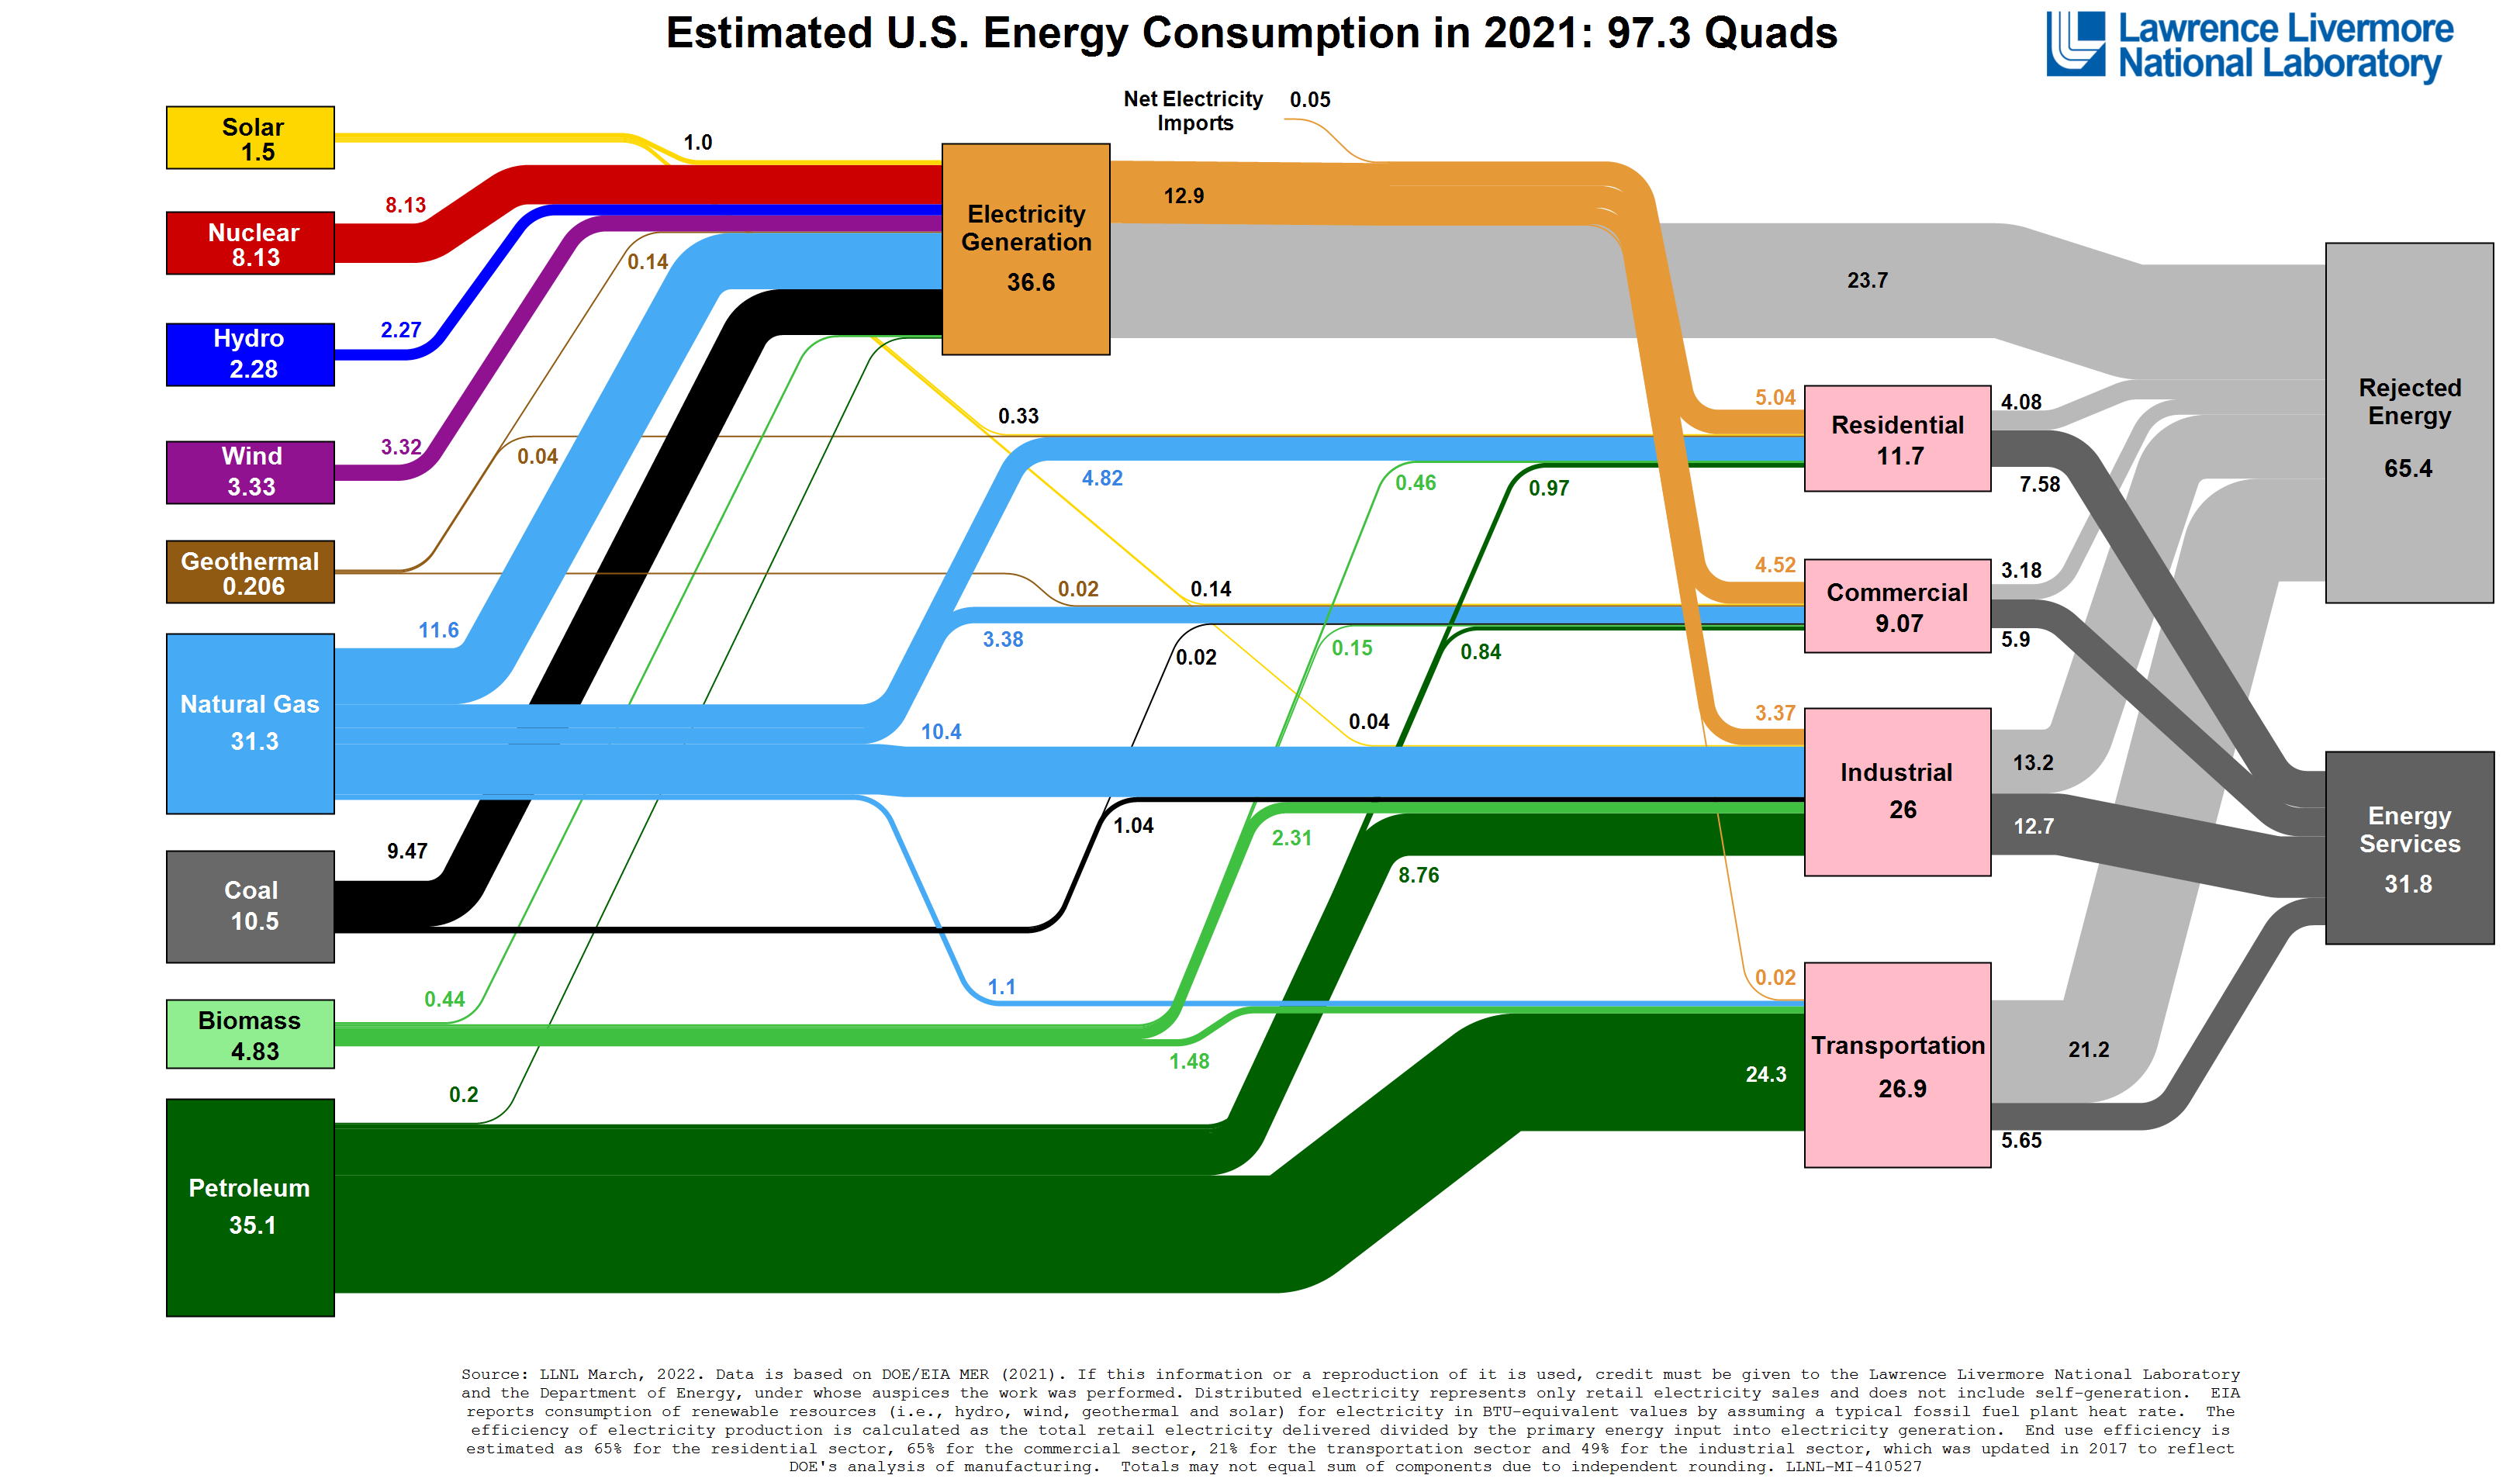
 I like a good infographic and this one showing annual energy flows for a country is one of my favourites [see ‘Energy blending’ on May 22nd 2013]. Some governments produce them annually. The image shows the latest one for the UK [2021]. It makes interesting but perhaps depressing reading. Transportation using fossil fuels accounts for 31% (41.6/134.1 million tonnes oil equivalent) of the UK energy consumption while electricity output accounts for only 21% (28.6/134.1 million tonnes oil equivalent). This implies that if all vehicles were powered by electricity then the output of our power stations would need to increase to 70.2 million tonnes oil equivalent or between two- and three-fold (excluding conversion & transmission losses). You can perform a similar analysis for the USA [see 2021 Energy flow chart from LLNL]. Fossil-fuelled transportation accounted for 25% (24.3/97.3 Quads) and electricity output 13% (12.9/97.3 Quads) so converting all transportation to be electrically powered requires a three-fold increase in electrical output from power stations. It is more difficult to find equivalent data for Japan; however, in 2014 [see Energy flow chart from I2CNER Kyushu University] fossil-fuelled transportation accounted for 32% (3.03/9.52 EJ) and electricity output 38% (3.66/9.52 EJ) so converting all transportation to be electrically powered requires a two-fold increase in electrical output from power stations. None of the above takes account of space heating mainly via fossil fuel or that many existing power stations are fossil-fuelled and need to be replaced in order to achieve net zero carbon emissions. Hence, the required scale of construction of power stations using renewable sources, including nuclear, solar and wind, is enormous and in most countries it is barely discussed let alone planned or started; leading to the conclusion that there is little chance of achieving net zero carbon emissions by 2050 as called for by the Paris agreement.
Inconvenient data about electricity generation
2 Replies


