Figure 9 from Yang et al, 2012. Map of plastic strain around the crack tip (0, 0) based on the full width of half the maximum of the discrete Fourier transforms of BSE images, together with thermoelastic stress analysis data (white line) and estimates of the plastic zone size based on approaches of Dugdale’s (green line) and Irwin’s (blue line; dimensions in millimetres).
It is almost impossible to manufacture metal components that are flawless. Every flaw or imperfection in a metallic component is a potential site for the initiation of a crack that could lead to the failure of the component [see ‘Alan Arnold Griffith’ on April 26th, 2017]. Hence, engineers are very interested in understanding the mechanisms of crack initiation and propagation so that these processes can be prevented or, at least, inhibited. It is relatively easy to achieve these outcomes by not applying loads that would supply the energy to drive failure processes; however, the very purpose of a metal component is often to carry load and hence a compromise must be reached. The deep understanding of crack initiation and propagation, required for an effective and safe compromise, needs detailed measurements of evolution of the crack and of its advancing front or tip [depending whether you are thinking in three- or two-dimensions]. When a metal is subjected to repeated cycles of loading, then a crack can grow incrementally with each load cycle; and in these conditions a small volume of material, just ahead of the crack and into which the crack is about to grow, has an important role in determining the rate of crack growth. The sharp geometry of the crack tip causes localisation of the applied load in the material ahead of the crack thus raising the stress sufficiently high to cause permanent deformation in the material on the macroscale. The region of permanent deformation is known as the crack tip plastic zone. The permanent deformation induces disruptions in the regular packing of the metal atoms or crystal lattice, which are known as dislocations and continued cyclic loading causes the dislocations to move and congregate around the crack tip. Ultimately, dislocations combine to form voids in the material and then voids coalesce to form the next extension of the crack. In reality, it is an oversimplification to refer to a crack tip because there is a continuous transition from a definite crack to definitely no crack via a network of loosely connected voids, unconnected voids, aggregated dislocations almost forming a void, to a progressively more dispersed crowd of dislocations and finally virgin or undamaged material. If you know where to look on a polished metal surface then you could probably see a crack about 1 mm in length and, with aid of an optical microscope, you could probably see the larger voids forming in the material ahead of the crack especially when a load is applied to open the crack. However, dislocations are very small, of the order tens of nanometres in steel, and hence not visible in an optical microscope because they are smaller than the wavelength of light. When dislocations congregate in the plastic zone ahead of the crack, they disturb the surface of the metal and causing a change its texture which can be detected in the pattern produced by electrons bouncing off the surface. At Michigan State University about ten years ago, using backscattered electron (BSE) images produced in a scanning electron microscope (SEM), we demonstrated that the change in texture could be measured and quantified by evaluating the frequency content of the images using a discrete Fourier transform (DFT). We collected 225 square images arranged in a chessboard pattern covering a 2.8 mm by 2.8 mm square around a 5 mm long crack in a titanium specimen which allowed us to map the plastic zone associated with the crack tip (figure 9 from Yang et al, 2012). The length of the side of each image was 115 microns and 345 pixels so that we had 3 pixels per micron which was sufficient to resolve the texture changes in the metal surface due to dislocation density. The images are from our paper published in the Proceedings of the Royal Society and the one below (figure 4 from Yang et al, 2012) shows four BSE images along the top at increasing distances from the crack tip moving from left to right. The middle row shows the corresponding results from the discrete Fourier transform that illustrate the decreasing frequency content of the images moving from left to right, i.e. with distance from the crack. The graphs in the bottom row show the profile through the centre of the DFTs. The grain structure in the metal can be seen in the BSE images and looks like crazy paving on a garden path or patio. Each grain has a particular and continuous crystal lattice orientation which causes the electrons to scatter differently from it compared to its neighbour. We have used the technique to verify measurements of the extent of the crack tip plastic zone made using thermoelastic stress analysis (TSA) and then used TSA to study ‘Crack tip plasticity in reactor steels’ [see post on March 13th, 2019].
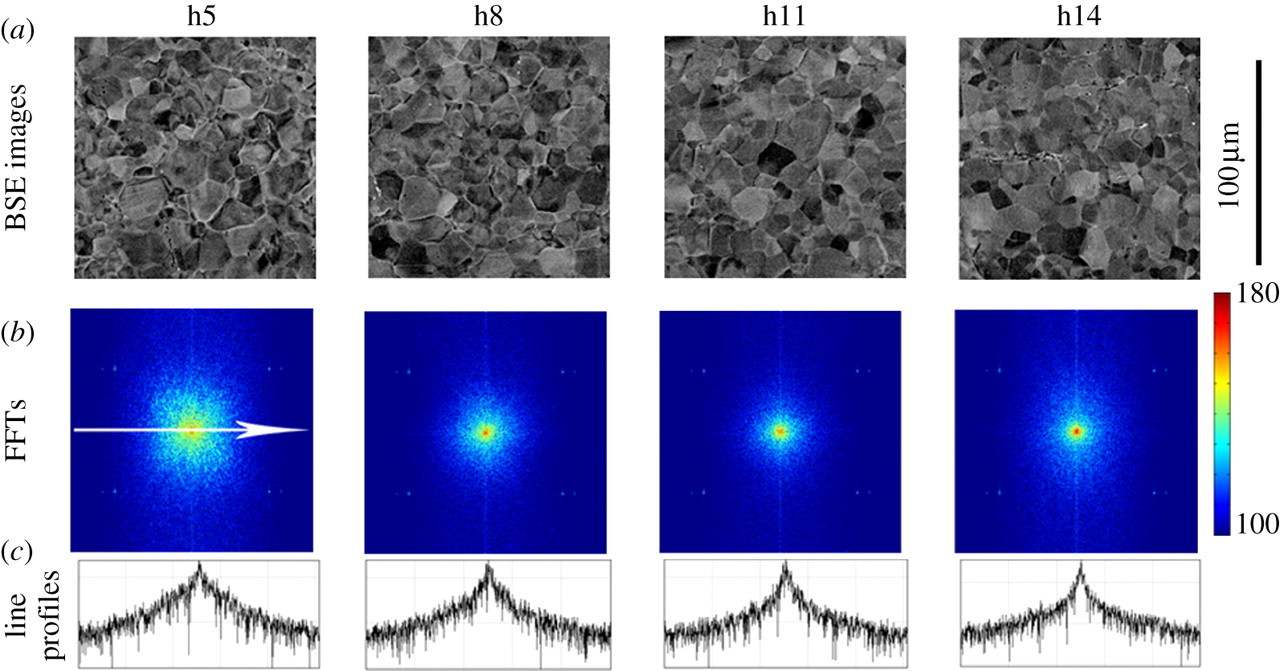
Figure 4 from Yang et al, 2012. (a) Backscattered electron images at increasing distance from crack from left to right; (b) their corresponding discrete Fourier transforms (DFTs) and (c) a horizontal line profile across the centre of each DFT.
Reference: Yang, Y., Crimp, M., Tomlinson, R.A., Patterson, E.A., 2012, Quantitative measurement of plastic strain field at a fatigue crack tip, Proc. R. Soc. A., 468(2144):2399-2415.