‘It was the worst of times, it was the worst of times. Again. That’s the things about things. They fall apart, always have, always will, it’s in their nature.’ They are the opening three lines of Ali Smith’s novel ‘Autumn’. Ali Smith doesn’t mention entropy but that’s what she is describing.
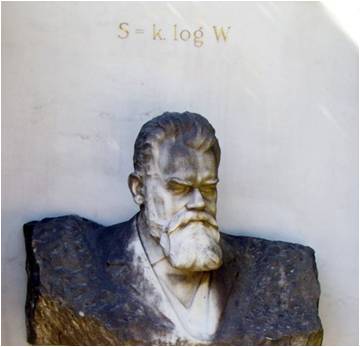
My first-year lecture course has progressed from the first law of thermodynamics to the second law; and so, I have been stretching the students’ brains by talking about entropy. It’s a favourite topic of mine but many people find it difficult. Entropy can be described as the level of disorder present in a system or the environment. Ludwig Boltzmann derived his famous equation, S=k ln W, which can be found on his gravestone – he died in 1906. S is entropy, k is a constant of proportionality named after Boltzmann, and W is the number of arrangements in which a system can be arranged without changing its energy content (ln means natural logarithm). So, the more arrangements that are possible then the larger is the entropy.
By now the neurons in your brain should be firing away nicely with a good level of synchronicity (see my post entitled ‘Digital hive mind‘ on November 30th, 2016 and ‘Is the world comprehensible?‘ on March 15th, 2017). In other words, groups of neurons should be showing electrical activity that is in phase with other groups to form large networks. Some scientists believe that the size of the network was indicative of the level of your consciousness. However, scientists in Toronto led by Jose Luis Perez-Velazquez, have suggested that it is not the size of the network that is linked to consciousness but the number of ways that a particular degree of connectivity can be achieved. This begins to sound like the entropy of your neurons.
In 1948 Claude Shannon, an American electrical engineer, stated that ‘information must be considered as a negative term in the entropy of the system; in short, information is negentropy‘. We can extend this idea to the concept that the entropy associated with information becomes lower as it is arranged, or ordered, into knowledge frameworks, e.g. laws and principles, that allow us to explain phenomena or behaviour.
Perhaps these ideas about entropy of information and neurons are connected; because when you have mastered a knowledge framework for a topic, such as the laws of thermodynamics, you need to deploy a small number of neurons to understand new information associated with that topic. However, when you are presented with unfamiliar situations then you need to fire multiple networks of neurons and try out millions of ways of connecting them, in order to understand the unfamiliar data being supplied by your senses.
For diverse posts on entropy see: ‘Entropy in poetry‘ on June 1st, 2016; ‘Entropy management for bees and flights‘ on November 5th, 2014; and ‘More on white dwarfs and existentialism‘ on November 16th, 2016.
Sources:
Ali Smith, Autumn, Penguin Books, 2017
Consciousness is tied to ‘entropy’, say researchers, Physics World, October 16th, 2016.
Handscombe RD & Patterson EA, The Entropy Vector: Connecting Science and Business, Singapore: World Scientific Publishing, 2004.