 A couple of weeks ago, I travelled to my first international conference following the pandemic lockdowns. It was stimulating to hear presentations from well-established researchers who I had not seen in person for four or five years and to meet new researchers who had joined our community since 2019. It was exciting to present our own research to an international audience for the first time and get instant feedback on it. Of course, it helped that we met in Orlando, Florida. If a change is as good as a rest then I had a four day rest from my usual work routines. You could call it a holiday in the sense that a holiday is a day of festivity during which we celebrate in a joyful or exuberant way, according to the dictionary, and I felt we joyfully celebrated our research. I gave three presentations on our work on low-cost, real-time crack monitoring described in ‘Seeing small changes is a big achievement’ on October 26th, 2022; on additive manufacture of reinforced flat plates (see ‘On flatness and roughness’ on January 19th, 2022); and on a further development of the research described in ‘Less certain predictions’ on August 2nd 2017. Listening to other speakers caused my own thoughts to wander and I found myself using my phone as a mental prosthetic or expert system [see ‘Thinking out of the skull’ on March 18th, 2015] to provide me with information about definitions, to remind me about previous research, both ours and other people’s, as well as to refresh my memory on previous ideas via this blog [see ‘Amplified intelligence’ on January 4th, 2023]. Susan Greenfield, feared that such devices and activity might lead to formation of smaller neuronal assemblies in the brain and consequential loss of creativity [see ‘Digital hive mind’ on November 30th 2016]; instead, I found myself making faster connections and creating new ideas for future research. However, I recorded them, as Leonardo di Vinci would have done – in my notebook! My excuse is that my phone was too busy being an expert system and writing my notes by hand allowed my brain to connect the fragments of ideas and thoughts into some sort of coherency [see ‘Space between the words’ on July 6th, 2022]. Besides writing four posts for this blog in as many days, I have a list of new ideas to accelerate existing projects and start new ones. So, whilst post-pandemic I will not be returning to business as usual in terms of international travel, a small number of infrequent trips would appear to be worthwhile, especially if our research helps move our economies towards their zero emissions targets.
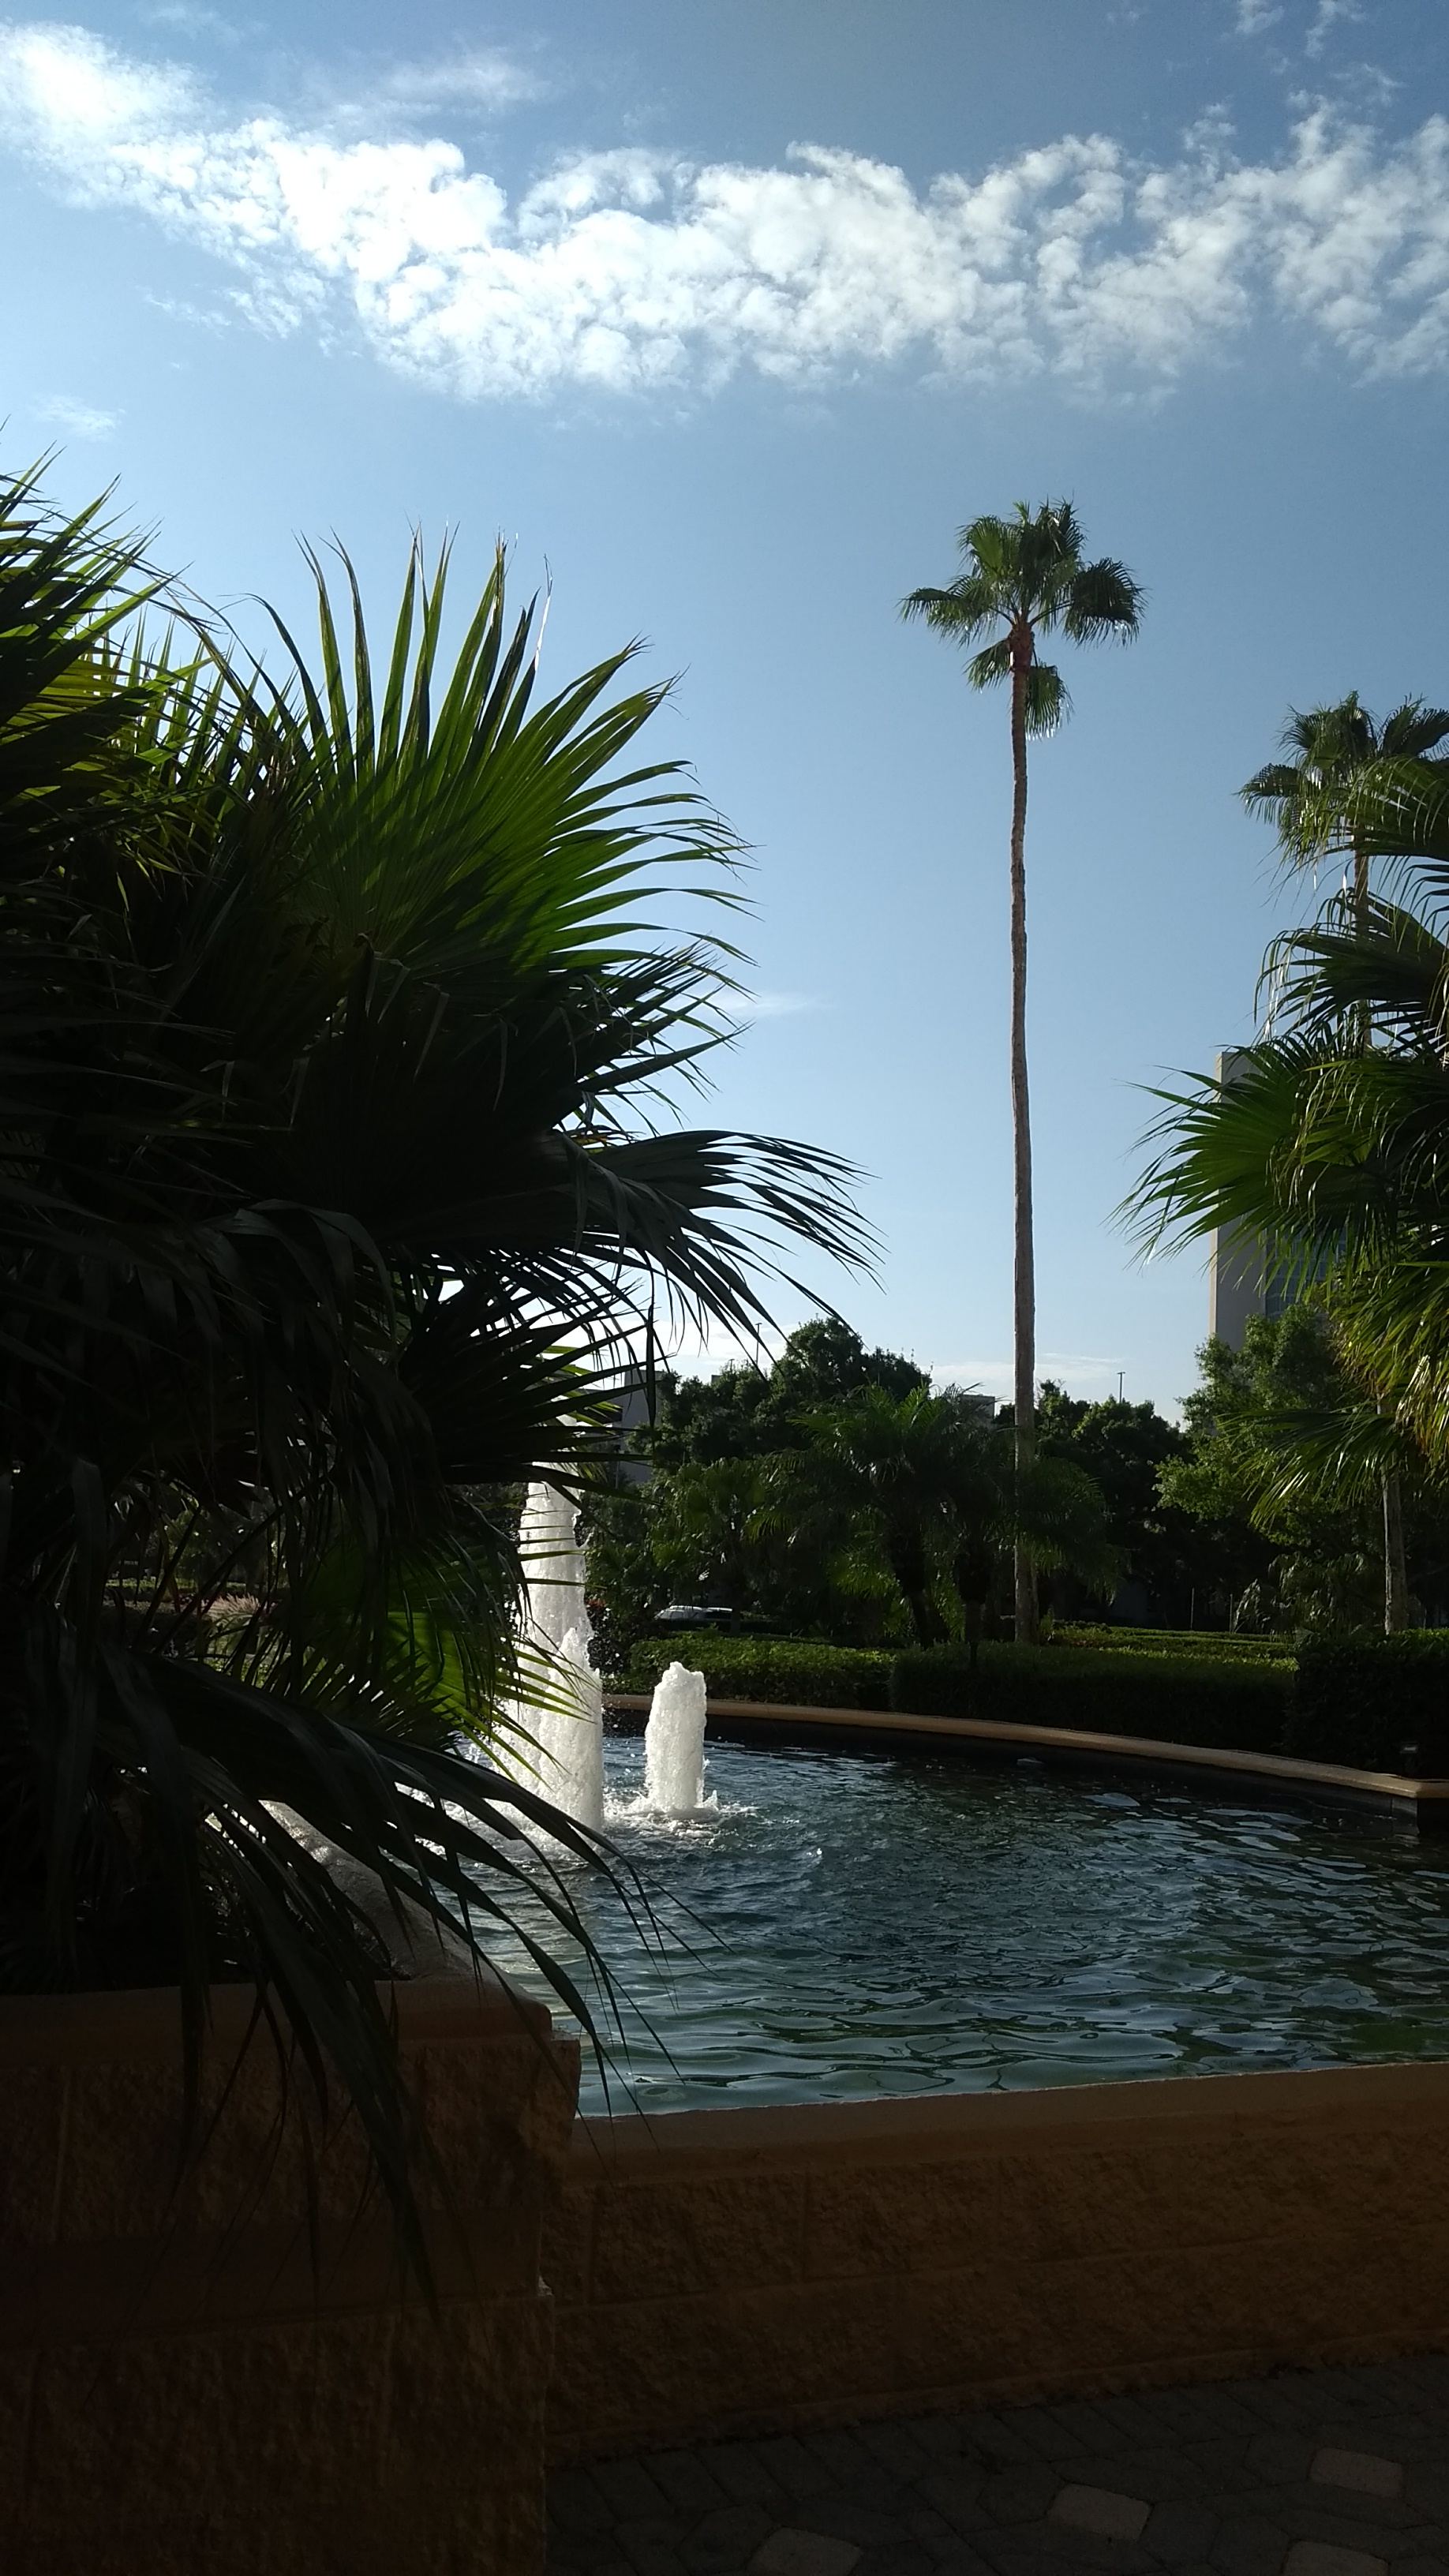
Image: photograph from entrance to conference hotel.