Category Archives: MyResearch

Models as fables

moel arthurIn his book, ‘Economic Rules – Why economics works, when it fails and how to tell the difference‘, Dani Rodrik describes models as fables – short stories that revolve around a few principal characters who live in an unnamed generic place and whose behaviour and interaction produce an outcome that serves as a lesson of sorts.  This seems to me to be a healthy perspective compared to the almost slavish belief in computational models that is common today in many quarters.  However, in engineering and increasingly in precision medicine, we use computational models as reliable and detailed predictors of the performance of specific systems.  Quantifying this reliability in a way that is useful to non-expert decision-makers is a current area of my research.  This work originated in aerospace engineering where it is possible, though expensive, to acquire comprehensive and information-rich data from experiments and then to validate models by comparing their predictions to measurements.  We have progressed to nuclear power engineering in which the extreme conditions and time-scales lead to sparse or incomplete data that make it more challenging to assess the reliability of computational models.  Now, we are just starting to consider models in computational biology where the inherent variability of biological data and our inability to control the real world present even bigger challenges to establishing model reliability.

Sources:
Dani Rodrik, Economic Rules: Why economics works, when it fails and how to tell the difference, Oxford University Press, 2015

Patterson, E.A., Taylor, R.J. & Bankhead, M., A framework for an integrated nuclear digital environment, Progress in Nuclear Energy, 87:97-103, 2016

Hack, E., Lampeas, G. & Patterson, E.A., An evaluation of a protocol for the validation of computational solid mechanics models, J. Strain Analysis, 51(1):5-13, 2016.

Patterson, E.A., Challenges in experimental strain analysis: interfaces and temperature extremes, J. Strain Analysis, 50(5): 282-3, 2015

Patterson, E.A., On the credibility of engineering models and meta-models, J. Strain Analysis, 50(4):218-220, 2015

Insidious damage

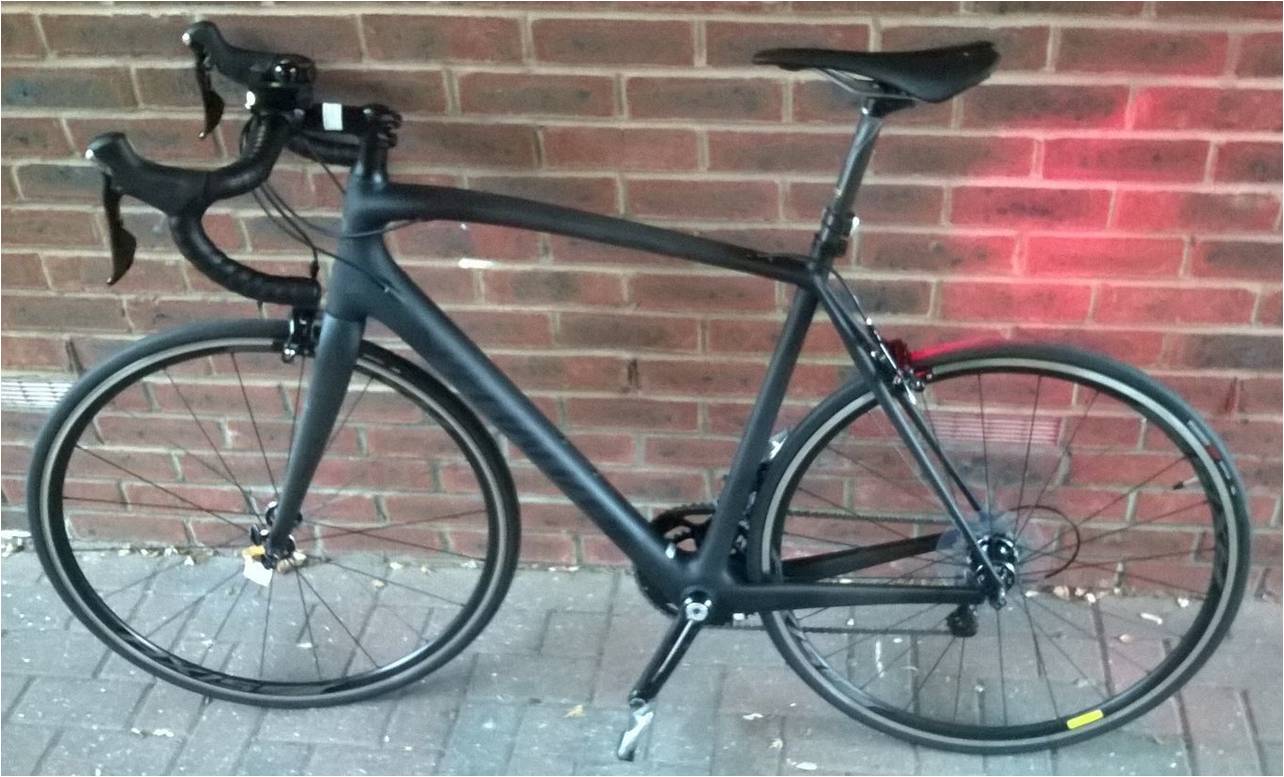
bikeRecently, my son bought a carbon-fibre framed bike for his commute to work. He talked to me about it before he made the decision to go ahead because he was worried about the susceptibility of carbon-fibre to impact damage. The aircraft industry worries about barely visible impact damage (BVID) because while the damage might be barely visible on the accessible face that received the impact, within the carbon-fibre component there can be substantial life-shortening damage. I reassured my son that it is unlikely a road bike would receive impacts of sufficient energy to induce life-shortening damage, at least in ordinary use. However, such impacts are not unusual in aircraft structures which means that they have to be inspected for hidden, insidious damage. The most common method of inspection is based on ultrasound that is reflected preferentially by the damaged areas so that the shape and extent of damage can be mapped. It is difficult to predict the effect on the structural performance of the component from this morphology information so that, when damage is found, the component is usually repaired or replaced immediately. In my research group we have been exploring the use of strain measurements to locate and assess damage by comparing the strain distributions in as-manufactured and in-service components. We can measure the strain fields in components using a number of techniques including digital image correlation (see my post entitled ‘256 shades of grey’) and thermoelastic stress analysis (see my post entitled ‘Counting photons to measure stress‘). The comparison is performed using feature vectors that represent the strain fields, see my post of a few weeks ago entitled ‘Recognising strain’. The guiding principle is that if damage is present but does not change the strain field then the structural performance of the component is unchanged; however when the strain field is changed then it is easier to predict remanent life from strain data than from morphology data. We have demonstrated that these new concepts work in glass-fibre reinforced laminates and are in the process of reproducing the results in carbon-fibre composites.

Sources

Patterson, E.A., Feligiotti, M., Hack, E., 2013, On the integration of validation, quality assurance and non-destructive evaluation, J. Strain Analysis, 48(1):48-59.

Patki, A.S., Patterson, E.A., 2012, Damage assessment of fibre reinforced composites using shape descriptors, J. Strain Analysis, 47(4):244-253.

Counting photons to measure stress

TSA pattern around a crack propagating from the left with its tip in the centre.

TSA pattern around a crack propagating from the left with its tip in the centre.

Some might find it strange that I am teaching thermodynamics when my research expertise is in structural materials and mechanics. However, the behaviour of structures is largely controlled by energy and how they absorb, store and release it; while thermodynamics is the study of energy flows and transformations, so there is a connection. In my research group, we exploit this connection in a technique for measuring stress fields in components by monitoring the temperature changes that occur when a component is loaded. In Thermoelastic Stress Analysis (TSA) as it is known, we use very sensitive infrared cameras to monitor the cyclic variations of temperature that occur when cyclic load is applied to a material. The temperature changes are of the order of milli-Kelvin, that’s thousandths of a degree, and are positive with negative, or compressive stress and negative with tensile stress. What we are actually measuring is the rate of change in the release of photons by atoms as they are pushed closer together in compression or pulled further apart in tension; but that’s another story and takes us into physics.

An exciting feature of this technique is that as a crack evolves new surfaces are formed which releases energy as heat. We can detect not only the stress field around the crack but also the heat released during the formation of the crack prior it being visible and its subsequent growth.

Sources:

Greene, R.J., Patterson, E.A., Rowlands, R.E., 2008, ‘Thermoelastic stress analysis’, in Handbook of Experimental Mechanics edited by W.N. Sharpe Jr., Springer, New York.

Yang, Y., Crimp, M., Tomlinson, R.A., Patterson, E.A., 2012, Quantitative measurement of plastic strain field at a fatigue crack tip, Proc. R. Soc. A., 468(2144):2399-2415.

Patki, A.S., Patterson, E.A., 2010, ‘Thermoelastic stress analysis of fatigue cracks subject to overloads’, Fatigue and Fracture of Engineering Materials and Structures, 33(12):809-821.


Recognizing strain

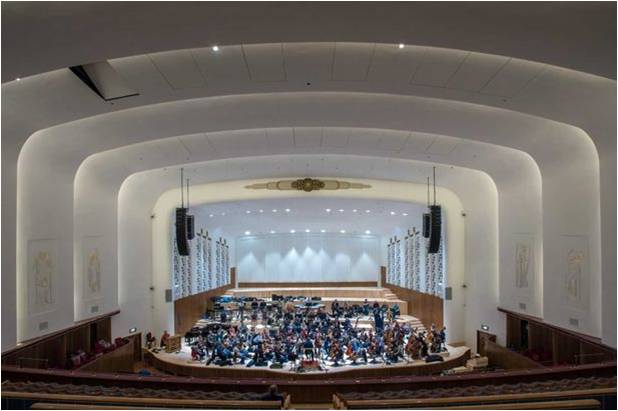
rlpoYou can step off an express train but you can’t speed up a donkey. This is paraphrased from ‘The Fly Trap’ by Fredrik Sjöberg in the context of our adoption of faster and faster technology and the associated life style. Last week we stepped briefly off the ‘express train’ and lowered our strain levels by going to a concert given by the Royal Liverpool Philharmonic Orchestra, including pieces by Dvorak, Chopin and Tchaikovsky. I am not musical at all and so I am unable to tell you much about the performances or compositions, except to say that I enjoyed the performances as did the rest of the audience to judge from the enthusiastic applause. A good deal of my enjoyment arose from the energy of the orchestra and my ability to recognise the musical themes or acoustic features in the pieces. The previous sentence was not intended as a critic’s perspective on the concert but a tenuous link…

Recognising features is one aspect of my recent research, though in strain data rather than music. Modern digital technology allows us to acquire information-rich data maps with tens of thousands of individual data values arranged in arrays or matrices, in which it can be difficult to spot patterns or features. We treat our strain data as images and use image decomposition to compress a data matrix into a feature vector. The diagram shows the process of image decomposition, in which a colour image is converted to a map of intensity in the image. The intensity values can be stored in a matrix and we can fit sets of polynomials to them by ‘tuning’ the coefficients in the polynomials. The coefficients are gathered together in a feature vector. The original data can be reconstructed from the feature vector if you know the set of polynomials used in the decomposition process, so decomposition is also a form of data compression. It is easier to recognise features in the small number of coefficients than in the original data map, which is why we use the process and why it was developed to allow computers to perform pattern recognition tasks such as facial recognition.

decompositionSources:

Wang W, Mottershead JE, Patki A, Patterson EA, Construction of shape features for the representation of full-field displacement/strain data, Applied Mechanics and Materials, 24-25:365-370, 2010.

Patki, A.S., Patterson, E.A, Decomposing strain maps using Fourier-Zernike shape descriptors, Exptl. Mech., 52(8):1137-1149, 2012.

Nabatchian A., Abdel-Raheem E., and Ahmadi M., 2008, Human face recognition using different moment invariants: a comparative review. Congress on Image and Signal Processing, 661-666.