Category Archives: Soapbox

How many repeats do we need?

This is a question that both my undergraduate students and a group of taught post-graduates have struggled with this month.  In thermodynamics, my undergraduate students were estimating absolute zero in degrees Celsius using a simple manometer and a digital thermometer (this is an experiment from my MOOC: Energy – Thermodynamics in Everyday Life).  They needed to know how many times to repeat the experiment in order to determine whether their result was significantly different to the theoretical value: -273 degrees Celsius [see my post entitled ‘Arbitrary zero‘ on February 13th, 2013 and ‘Beyond  zero‘ the following week]. Meanwhile, the post-graduate students were measuring the strain distribution in a metal plate with a central hole that was loaded in tension. They needed to know how many times to repeat the experiment to obtain meaningful results that would allow a decision to be made about the validity of their computer simulation of the experiment [see my post entitled ‘Getting smarter‘ on June 21st, 2017].

The simple answer is six repeats are needed if you want 98% confidence in the conclusion and you are happy to accept that the margin of error and the standard deviation of your sample are equal.  The latter implies that error bars of the mean plus and minus one standard deviation are also 98% confidence limits, which is often convenient.  Not surprisingly, only a few undergraduate students figured that out and repeated their experiment six times; and the post-graduates pooled their data to give them a large enough sample size.

The justification for this answer lies in an equation that relates the number in a sample, n to the margin of error, MOE, the standard deviation of the sample, σ, and the shape of the normal distribution described by the z-score or z-statistic, z*: 
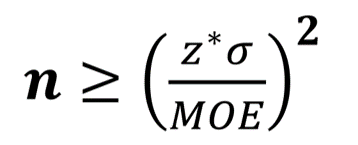
The margin of error, MOE, is the maximum expected difference between the true value of a parameter and the sample estimate of the parameter which is usually the mean of the sample.  While the standard deviation, σ,  describes the difference between the data values in the sample and the mean value of the sample, μ.  If we don’t know one of these quantities then we can simplify the equation by assuming that they are equal; and then n ≥ (z*)².

The z-statistic is the number of standard deviations from the mean that a data value lies, i.e, the distance from the mean in a Normal distribution, as shown in the graphic [for more on the Normal distribution, see my post entitled ‘Uncertainty about Bayesian methods‘ on June 7th, 2017].  We can specify its value so that the interval defined by its positive and negative value contains 98% of the distribution.  The values of z for 90%, 95%, 98% and 99% are shown in the table in the graphic with corresponding values of (z*)², which are equivalent to minimum values of the sample size, n (the number of repeats).

Confidence limits are defined as: but when n = , this simplifies to μ ± σ.  So, with a sample size of six (6 = n   for 98% confidence) we can state with 98% confidence that there is no significant difference between our mean estimate and the theoretical value of absolute zero when that difference is less than the standard deviation of our six estimates.

BTW –  the apparatus for the thermodynamics experiments costs less than £10.  The instruction sheet is available here – it is not quite an Everyday Engineering Example but the experiment is designed to be performed in your kitchen rather than a laboratory.

Getting it wrong

Filming for the MOOC Energy: Thermodynamics in Everyday Life

Last week’s post was stimulated by my realisation that I had made a mistake in a lecture [see ‘Amply sufficiency of solar energy?‘ on October 25th, 2017]. During the lecture, something triggered a doubt about a piece of information that I used in talking about the world as a thermodynamic system. It caused me to do some more research on the topic afterwards which led to the blog post.  The students know this already, because I sent an email to them as the post was published.  It was not an error that impacted on the fundamental understanding of the thermodynamic principles, which is fortunate because we are at a point in the course where students are struggling to understand and apply the principles to problems.  This is a normal process from my perspective but rather challenging and uncomfortable for many students.  They are developing creative problem-solving skills – becoming comfortable with the slow and uncertain process of creating representations and exploring the space of possible solutions [Martin & Schwartz, 2009 & 2014].  This takes extensive practice and most students want a quick fix: usually looking at a worked solution, which might induce the feeling that some thermodynamics has been understood but does nothing for problem-solving skills [see my post on ‘Meta-representational competence‘ on May 13th, 2015].

Engineers don’t like to be wrong [see my post on ‘Engineers are slow, error-prone‘ on April 29th, 2014].  The reliability of our solutions and designs is a critical ingredient in the social trust of engineering [Madhaven, 2016].  So, not getting it wrong is deeply embedded in the psyche of most engineers.  It is difficult to persuade most engineers to appear in front of a camera because we worry, not just about not getting it wrong, but about telling the whole truth.  The whole truth is often inconvenient for those that want to sensationalize issues for their own purposes, such as to sell news or gain votes, and this approach is anathema to many engineers.  The truth is also often complicated and nuanced, which can render an engineer’s explanation cognitively less attractive than a simple myth, or in other words less interesting and boring.  Unfortunately, people mainly pass on information that will cause an emotional response in the recipient, which is perhaps why engineering blogs are not as widely read as many others! [Lewandowsky et al 2012].


This week’s lecture was about energy flows, and heat transfer in particular; so, the following posts from the archive might be interest: ‘On the beach‘ on July 24th, 2013, ‘Noise transfer‘ on April 3rd, 2013, and ‘Stimulating students with caffeine‘ on December 17th, 2014

Sources:

Martin L & Schwartz DL, Prospective adaptation in the use of external representations, Cognition and Instruction, 27(4):370-400, 2009.

Martin L & Schwartz DL, A pragmatic perspective on visual representation and creative thinking, Visual Studies, 29(1):80-93, 2014.

Madhaven G, Think like an engineer, London: One World Publications, 2016.

Lewandowsky S, Ecker UKH, Seifert CM, Schwarz N & Cook J, Misinformation and its correction: continued influence and successful debiasing, Psychological Science in the Public Interest, 13(3):106-131, 2012.

Ample sufficiency of solar energy?

Global energy budget from Trenberth et al 2009

I have written several times about whether or not the Earth is a closed system [see for example: ‘Is Earth a closed system? Does it matter‘ on December 10th, 2014] & ‘Revisiting closed systems in Nature‘ on October 5th, 2016).  The Earth is not a closed thermodynamic system because there is energy transfer between the Earth and its surroundings as illustrated by the schematic diagram. Although, the total incoming solar radiation (341 Watts/sq. metre (W/m²)) is balanced by the sum of the reflected solar radiation (102 W/m²) and the outgoing longwave radiation (239 W/m²); so, there appears to be no net inflow or outflow of energy.  To put these values into perspective, the world energy use per capita in 2014 was 1919 kilograms oil equivalent, or 2550 Watts (according to World Bank data); hence, in crude terms we each require 16 m² of the Earth’s surface to generate our energy needs from the solar energy reaching the ground (161 W/m²), assuming that we have 100% efficient solar cells available. That’s a big assumption because the best efficiencies achieved in research labs are around 48% and for production solar cells it’s about 26%.

There are 7.6 billion of us, so at 16 m² each, we need  120,000 square kilometres of 100% efficient solar cells – that’s about the land area of Greece, or about 500,000 square kilometres with current solar cells, which is equivalent to the land area of Spain.  I picked these countries because, compared to Liverpool, the sun always shines there; but of course it doesn’t, and we would need more than this half million square kilometres of solar cells distributed around the world to allow the hours of darkness and cloudy days.

At the moment, China has the most generating capacity from photovoltaic (PV) cells at 78.07 GigaWatts or about 25% of global PV capacity and Germany is leading in terms of per capita generating capacity at 511 Watts per capita, or 7% of their electricity demand.  Photovoltaic cells have their own ecological footprint in terms of the energy and material required for their production but this is considerably lower than most of our current sources of energy [see, for example Emissions from photovoltaic life cycles by Fthenakis et al, 2008].

Sources:

Trenberth KE, Fasullo JT & Kiehl J, Earth’s global energy budget, Bulletin of  the American Meteorological Society, March 2009, 311-324, https://doi.org/10.1175/2008BAMS2634.1.

World Bank Databank: https://data.worldbank.org/indicator/EG.USE.PCAP.KG.OE

Nield D, Scientists have broken the efficiency record for mass-produced solar panels, Science Alert, 24th March 2017.

2016 Snapshot of Global Photovoltaic Markets, International Energy Agency Report IEA PVPS T1-31:2017.

Fthenakis VM, Kim HC & Alsema E, Emissions from photovoltaic life cycles, Environmental Science Technology, 42:2168-2174, 2008.

Red to blue

Some research has a very long incubation time.  Last month, we published a short paper that describes the initial results of research that started just after I arrived in Liverpool in 2011.  There are various reasons for our slow progress, including our caution about the validity of the original idea and the challenges of working across discipline boundaries.  However, we were induced to rush to publication by the realization that others were catching up with us [see blog post and conference paper].  Our title does not give much away: ‘Characterisation of metal fatigue by optical second harmonic generation‘.

Second harmonic generation or frequency doubling occurs when photons interact with a non-linear material and are combined to produce new photons with twice the energy, and hence, twice the frequency and half the wavelength of the original photons.  Photons are discrete packets of energy that, in our case, are supplied in pulses of 2 picoseconds from a laser operating at a wavelength of 800 nanometres (nm).  The photons strike the surface, are reflected, and then collected in a spectrograph to allow us to evaluate the wavelength of the reflected photons.  We look for ones at 400 nm, i.e. a shift from red to blue.

The key finding of our research is that the second harmonic generation from material in the plastic zone ahead of a propagating fatigue crack is different to virgin material that has experienced no plastic deformation.  This is significant because the shape and size of the crack tip plastic zone determines the rate and direction of crack propagation; so, information about the plastic zone can be used to predict the life of a component.  At first sight, this capability appears similar to thermoelastic stress analysis that I have described in Instructive Update on October 4th, 2017; however, the significant potential advantage of second harmonic generation is that the component does not have to be subject to a cyclic load during the measurement, which implies we could study behaviour during a load cycle as well as conduct forensic investigations.  We have some work to do to realise this potential including developing an instrument for routine measurements in an engineering laboratory, rather than an optics lab.

Last week, I promised weekly links to posts on relevant Thermodynamics topics for students following my undergraduate module; so here are three: ‘Emergent properties‘, ‘Problem-solving in Thermodynamics‘, and ‘Running away from tigers‘.