 This year I have written about 20,000 words in 52 posts (including this one); and, since this is the last post of the year, I thought I would take a brief look back at what has preoccupied me in 2021. Perhaps, not surprisingly the impact of the coronavirus on our lifestyle has featured regularly – almost every week for a month between mid-March and mid-April when we were in lockdown in the UK. However, the other topics that I have written about frequently are my research on the dynamics of nanoparticles and, in the last six months, on dealing with uncertainty in digital engineering and decision making. I have also returned several times to innovation processes and transitioning lab-based research into industry. While following the COP26 in early November, I wrote a series of three posts focussed on energy consumption and the paradigm shifts required to slow down climate change. There are some connections between these topics: viruses are nanoparticles whose transport and dynamics we do not fully understand; and, digital engineering tools are being used to explore zero-carbon approaches to, for example, energy generation and air transport. The level of complexity, innovation and urgency associated with developing solutions to these challenges mean that there are always some unknowns and uncertainty when making associated decisions.
The links below are grouped by the topics mentioned above. I expect there will be more on all of these topics in 2022; however, the topic of next week’s post is unknown because I have not written any posts in advance. I hope that the uncertainty about the topic of the next post will keep you reading in 2022!
Coronavirus pandemic: ‘Distancing ourselves from each other‘ on January 13th, 2021; ‘On the impact of writing on well-being‘ on March 3rd, 2021; ‘Collegiality as a defence against pandemic burnout‘ on March 24th, 2021; ‘It’s tiring looking at yourself‘ on March 31st, 2021; ‘Switching off and walking in circles‘ on April 7th, 2021; ‘An upside to lockdown‘ on April 14th, 2021; ‘A brief respite in a long campaign to overcome coronavirus‘ on June 23rd, 2021; and ‘It is hard to remain positive‘ November 3rd 2021.
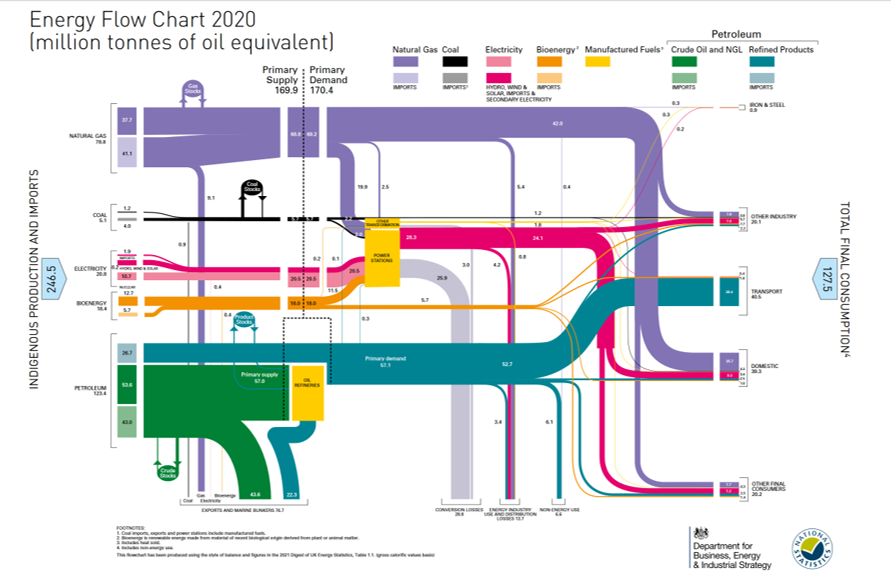
Energy and climate change: ‘When you invent the ship, you invent the shipwreck‘ on August 25th, 2021; ‘It is hard to remain positive‘ November 3rd 2021; ‘Where we are and what we have‘ on November 24th, 2021; ‘Disruptive change required to avoid existential threats‘ on December 1st, 2021; and ‘Bringing an end to thermodynamic whoopee‘ on December 8th, 2021.
Innovation processes: ‘Slowly crossing the valley of death‘ on January 27th, 2021; ‘Out of the valley of death into a hype cycle?‘ on February 24th, 2021; ‘Innovative design too far ahead of the market?‘ on May 5th, 2021 and ‘Jigsaw puzzling without a picture‘ on October 27th, 2021.
Nanoparticles: ‘Going against the flow‘ on February 3rd, 2021; ‘Seeing things with nanoparticles‘ on March 10th, 2021; and ‘Nano biomechanical engineering of agent delivery to cells‘ on December 15th, 2021.
Uncertainty: ‘Certainty is unattainable and near-certainty is unaffordable‘ on May 12th, 2021; ‘Neat earth objects make tomorrow a little less than certain‘ on May 26th, 2021; ‘Negative capability and optimal ambiguity‘ on July 7th, 2021; ‘Deep uncertainty and meta ignorance‘ on July 21st, 2021; ‘Somethings will always be unknown‘ on August 18th, 2021; ‘Jigsaw puzzling without a picture‘ on October 27th, 2021; and, ‘Do you know RIO?‘ on November 17th, 2021.

![figure 1 from [1] with text explanation](https://realizeengineering.blog/wp-content/uploads/2021/12/giorgi-et-al-rsos-8-210068.jpg)