 One of the exciting aspects of leading a university research group is that you can never be quite sure where the research is going next. We published a nice example of this unpredictability last week in Royal Society Open Science in a paper called ‘Transformation of measurement uncertainties into low-dimensional feature space‘ [1]. While the title is an accurate description of the contents, it does not give much away and certainly does not reveal that we proposed a new method for assessing the occurrence of El Niño events. For some time we have been working with massive datasets of measurements from arrays of sensors and representing them by fitting polynomials in a process known as image decomposition [see ‘Recognising strain‘ on October 28th, 2015]. The relatively small number of coefficients from these polynomials can be collated into a feature vector which facilitates comparison with other datasets [see for example, ‘Out of the valley of death into a hype cycle‘ on February 24th, 2021]. Our recent paper provides a solution to the issue of representing the measurement uncertainty in the same space as the feature vector which is roughly what we set out to do. We demonstrated our new method for representing the measurement uncertainty by calibrating and validating a computational model of a simple beam in bending using data from an earlier study in a EU-funded project called VANESSA [2] — so no surprises there. However, then my co-author and PhD student, Antonis Alexiadis went looking for other interesting datasets with which to demonstrate the new method. He found a set of spatially-varying uncertainties associated with a metamodel of soil moisture in a river basin in China [3] and global oceanographic temperature fields collected monthly over 11 years from 2002 to 2012 [4]. We used the latter set of data to develop a new technique for assessing the occurrence of El-Niño events in the Pacific Ocean. Our technique is based on global ocean dynamics rather than on the small region in the Pacific Ocean which is usually used and has the added advantages of providing a confidence level on the assessment as well as enabling straightforward comparisons of predictions and measurements. The comparison of predictions and measurements is a recurring theme in our current research but I did not expect it to lead into ocean dynamics.
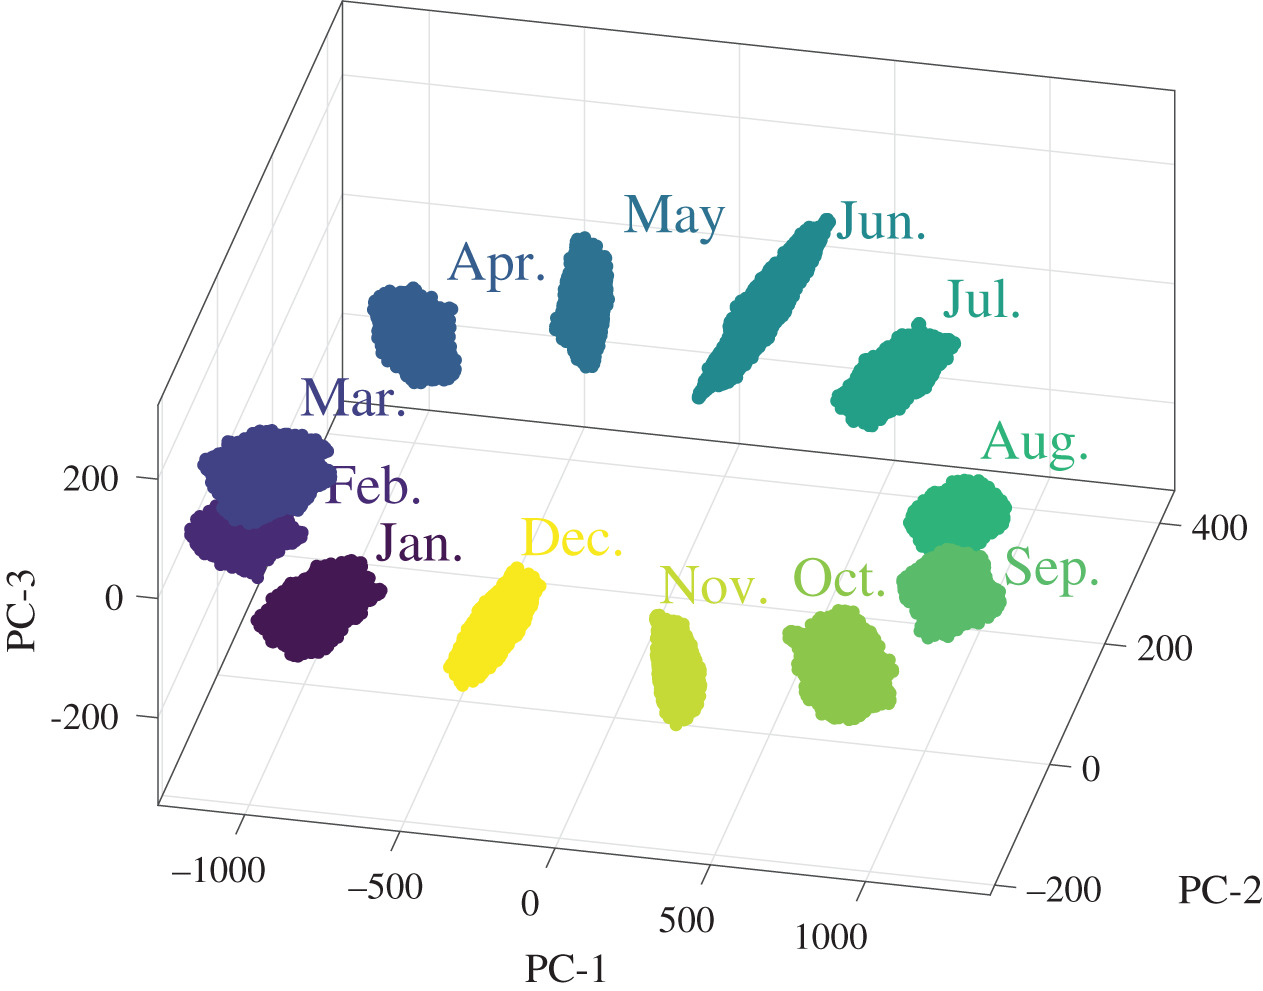
Image is Figure 11 from [1] showing convex hulls fitted to the cloud of points representing the uncertainty intervals for the ocean temperature measurements for each month in 2002 using only the three most significant principal components . The lack of overlap between hulls can be interpreted as implying a significant difference in the temperature between months.
References:
[1] Alexiadis, A. and Ferson, S. and Patterson, E.A., , 2021. Transformation of measurement uncertainties into low-dimensional feature vector space. Royal Society Open Science, 8(3): 201086.
[2] Lampeas G, Pasialis V, Lin X, Patterson EA. 2015. On the validation of solid mechanics models using optical measurements and data decomposition. Simulation Modelling Practice and Theory 52, 92-107.
[3] Kang J, Jin R, Li X, Zhang Y. 2017, Block Kriging with measurement errors: a case study of the spatial prediction of soil moisture in the middle reaches of Heihe River Basin. IEEE Geoscience and Remote Sensing Letters, 14, 87-91.
[4] Gaillard F, Reynaud T, Thierry V, Kolodziejczyk N, von Schuckmann K. 2016. In situ-based reanalysis of the global ocean temperature and salinity with ISAS: variability of the heat content and steric height. J. Climate. 29, 1305-1323.
 At the end of a lecture on energy flows in my first year undergraduate course on thermodynamics, I talk about nozzles and diffusers as examples of practical applications of the rest of the material in the lecture. It is hazardous to sit in the front row of the lecture theatre because I take in a water bottle with a trigger spray to demonstrate how the nozzle increases the velocity of the fluid at the expense of pressure while gently sprinkling water on the front row. I am always intrigued by the symmetry of nozzles and diffusers. Diffusers increase pressure of a fluid at the expense of its velocity, i.e., a mirror image of the action of a nozzle. The cross-sections are also mirror images because a nozzle has a cross-section that decreases in the flow direction while a diffuser has a cross-section that increases in the flow direction. At least for sub-sonic flows, because the shapes are reversed for super-sonic flow; so a sub-sonic nozzle looks like a super-sonic diffuser and a sub-sonic diffuser looks like a super-sonic nozzle. If that all sounds like fluid mechanics then the thermodynamic message is that, in nozzles and diffusers, the rates of heat and work transfer are approximately zero while the change in the kinetic energy of the fluid is very large. I finish the lecture with a video clip of a school quartet of trombones playing ‘Stars and Stripes Forever’ which wakes up the students who have slept through the lecture and allows me to point out the diffusers (bell of the trombone) transmitting acoustic pressure.
![figure 1 from [1] with text explanation](https://realizeengineering.blog/wp-content/uploads/2021/12/giorgi-et-al-rsos-8-210068.jpg)