Climate change and tides in Liverpool

image-20141201-20565-1eoo7rhIf you live within sight of the sea, as we do, then your life is probably influenced, to some degree, by the rise and fall of tides.  In Liverpool, we are lucky to have a particularly long historical record of tidal heights and one of my colleagues, an oceanographer, Professor Ric Williams has used this record to discuss climate variability.  The record was started and maintained between 1768 and 1793 by Captain William Hutchinson whose achievement is commemorated with a fountain in Liverpool’s historic docks, which are a UNESCO World Heritage Site.

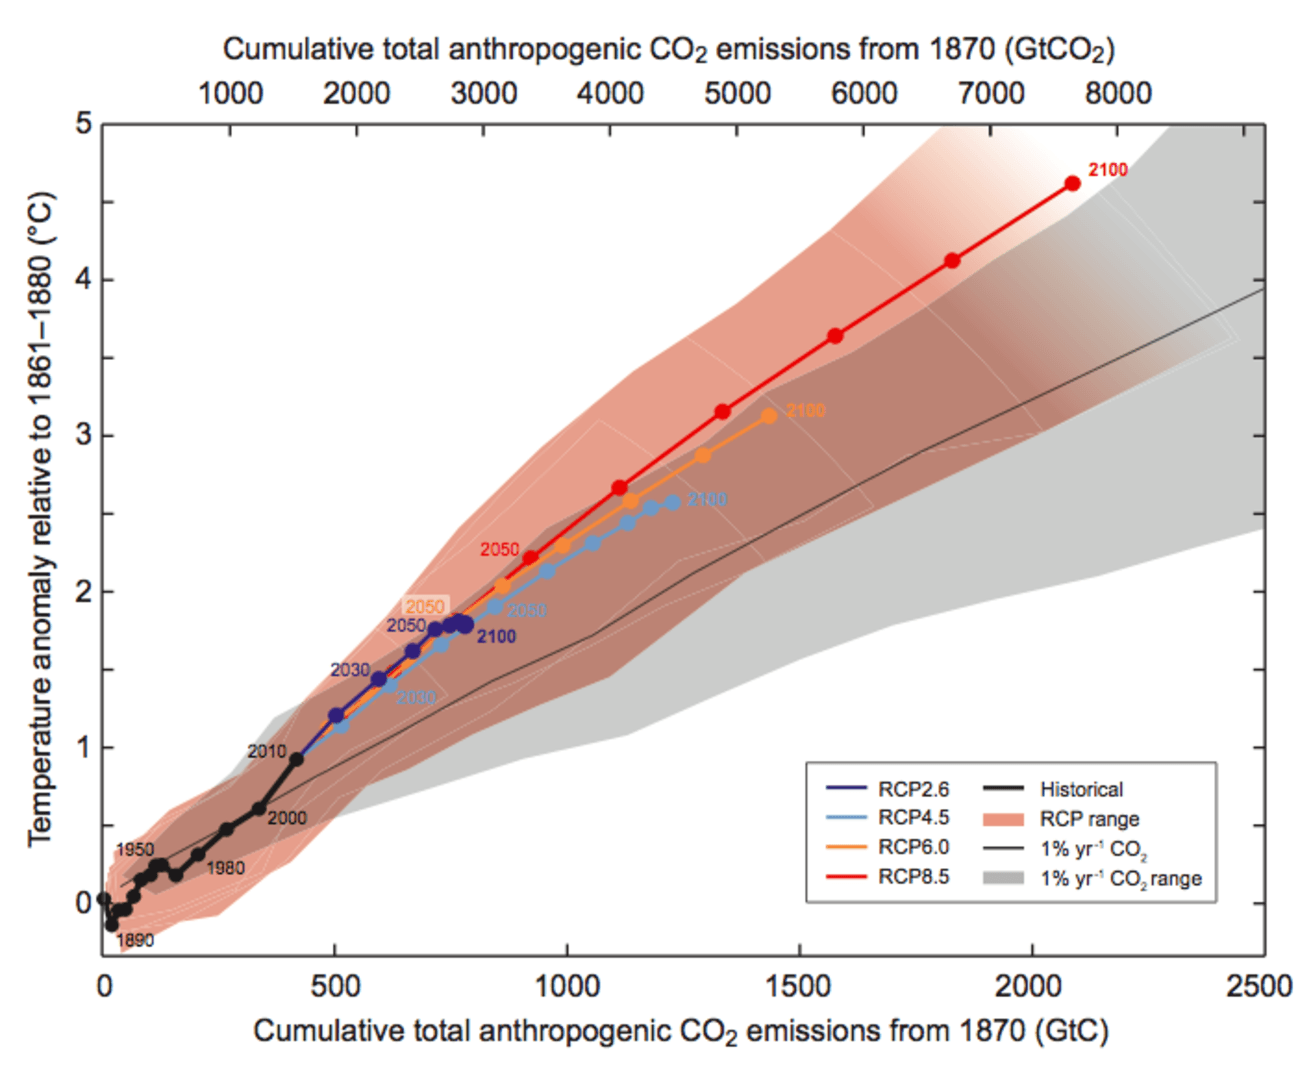
A few weeks ago I listened to a talk by Prof Williams, in which he described how there is a rather simple relationship between surface warming and the effect of future emissions of greenhouse gases.  If the predictions of surface warming are plotted as a function of how much carbon is emitted to the atmosphere, rather than time, then a simple response emerges: the more carbon we emit, the warmer it will get. Associated with the surface warming, there is an expected sea level rise from the expansion of the water column augmented by the effect of addition of freshwater from melting of land ice. Watch Prof Williams’ Youtube video to find out more.

Sources:

Woodworth, P.L. 1999. High waters at Liverpool since 1768: the UK’s longest sea level record. Geophysical Research Letters, 26 (11), 1589-1592.

Goodwin, P., Williams, R.G. & Ridgwell, A., Sensitivity of climate to cumulative carbon emissions dues to compensation of ocean heat and carbon uptake, Nature Geoscience, 8,29–34(2015).

Image: http://theconversation.com/our-equation-proves-climate-change-is-linked-to-emissions-34897


Horizon therapy

A couWP_20160401_003ple of weeks ago I discovered a new expression: ‘horizon therapy’.  I came across it in an exhibition at the British Museum in London.  I had spent two days at a symposium on inclusivity in engineering education and when it finished, I sauntered into the British Museum for a bit of mind-wandering [see my post entitled ‘Mind-wandering‘ on September 3rd, 2014]  because the museum had late-night opening and I had a couple of hours before my evening train home.  I wandered into an exhibition called ‘Living and Dying’ that contained an installation called ‘Cradle to Grave‘ by Pharmacopoeia and funded by the Wellcome Trust.

No explanation was given for the term ‘horizon therapy’ that appeared under a snap-shot of a man admiring a sea-view.  However, I assumed it meant achieving that feeling of well-being that derives from looking at a distant horizon with a ‘big’ sky above it.  It induces a sense of oneness with the world and a sense of calm associated with the wide-open space.  I find it can happen at sea, on the beach, in the mountains or on the open plains.  I suspect that it’s part of the reason so many city-dwellers head out to these places at every opportunity.  We did during the Easter break and the photo shows one of my daughters soaking up ‘horizon therapy’ on the top of Stickle Pike in the English Lake District.

So, next time you are feeling hemmed in by the problems and pressures around you, seek out some horizon therapy; even if there is only time to climb to the top floor of the nearest tall building and soak up the view.

BTW the exhibition has induced other reactions, see for example:

http://www.theguardian.com/artanddesign/jonathanjonesblog/2009/jul/24/medicine-cabinet-british-museum

https://herenowhealing.com/truth-beauty/files/cradle-to-grave-british-museum.html

https://humanitiesandhealth.wordpress.com/2011/04/18/pharmacopoiea-or-how-many-pills-do-we-take-in-a-lifetime-a-wellcome-trust-exhibition-at-the-british-museum/

Opal offers validation opportunity for climate models

OrangeFanSpongeSmallMany of us will be familiar with the concept of the carbon cycle, but what about the silicon cycle?  Silicon is the second most abundant element in the Earth’s crust.  As a consequence of erosion, it is carried by rivers into the sea where organisms, such as sponges and diatoms (photosynthetic algae), convert the silicon in seawater into opal that ends up in ocean sediment when these organisms die.  This marine silicon cycle can be incorporated into climate models, since each step is influenced by climatic conditions, and the opal sediment distribution from deep sea sediment cores can be used for model validation.

This approach can assist in providing additional confidence in climate models, which are notoriously difficult to validate, and was described by Katharine Hendry, a Royal Society University Research Fellow at the University of Bristol at a recent conference at the Royal Society.  This struck me as an out-of-the box or lateral way of seeking to increase confidence in climate models.

There are many examples in engineering where we tend to shy away from comprehensive validation of computational models because the acquisition of measured data seems too difficult and, or expensive.  We should take inspiration from sponges – by looking for data that is not necessarily the objective of the modelling but that nevertheless characterises the model’s behaviour.

Source:

Thumbnail: http://www.aquariumcreationsonline.net/sponge.html

Credibility is in the eye of the beholder

Picture1Last month I described how computational models were used as more than fables in many areas of applied science, including engineering and precision medicine [‘Models as fables’ on March 16th, 2016].  When people need to make decisions with socioeconomic and, or personal costs, based on the predictions from these models, then the models need to be credible.  Credibility is like beauty, it is in the eye of the beholder.   It is a challenging problem to convince decision-makers, who are often not expert in the technology or modelling techniques, that the predictions are reliable and accurate.  After all, a model that is reliable and accurate but in which decision-makers have no confidence is almost useless.  In my research we are interested in the credibility of computational mechanics models that are used to optimise the design of load-bearing structures, whether it is the frame of a building, the wing of an aircraft or a hip prosthesis.  We have techniques that allow us to characterise maps of strain using feature vectors [see my post entitled ‘Recognising strain‘ on October 28th, 2015] and then to compare the ‘distances’ between the vectors representing the predictions and measurements.  If the predicted map of strain  is an perfect representation of the map measured in a physical prototype, then this ‘distance’ will be zero.  Of course, this never happens because there is noise in the measured data and our models are never perfect because they contain simplifying assumptions that make the modelling viable.  The difficult question is how much difference is acceptable between the predictions and measurements .  The public expect certainty with respect to the performance of an engineering structure whereas engineers know that there is always some uncertainty – we can reduce it but that costs money.  Money for more sophisticated models, for more computational resources to execute the models, and for more and better quality measurements.