![]() I spent the first full-week of January 2019 at a Winter School for a pair of Centres for Doctoral Training focussed on Nuclear Energy (see NGN CDT & ICO CDT). Together the two centres involve eight UK universities and most of the key players in the UK industry. So, the Winter School offers an opportunity for researchers in nuclear science and engineering, from academia and industry, to gather together for a week and share their knowledge and experience with more than 80 PhD students. Each student gives a report on the progress of their research to the whole gathering as either a short oral presentation or a poster. It’s an exhausting but stimulating week for everyone due to both the packed programmme and the range of subjects covered from fundamental science through to large-scale engineering and socio-economic issues.
I spent the first full-week of January 2019 at a Winter School for a pair of Centres for Doctoral Training focussed on Nuclear Energy (see NGN CDT & ICO CDT). Together the two centres involve eight UK universities and most of the key players in the UK industry. So, the Winter School offers an opportunity for researchers in nuclear science and engineering, from academia and industry, to gather together for a week and share their knowledge and experience with more than 80 PhD students. Each student gives a report on the progress of their research to the whole gathering as either a short oral presentation or a poster. It’s an exhausting but stimulating week for everyone due to both the packed programmme and the range of subjects covered from fundamental science through to large-scale engineering and socio-economic issues.
Here are a few things that caught my eye:
First, the images in the thumbnail above which Paul Cosgrove from the University of Cambridge used to introduce his talk on modelling thermal and neutron fluxes. They could be from an art gallery but actually they are from the VTT Technical Research Centre of Finland and show the geometry of an advanced test reactor [ATR] (top); the rate of collisions in the ATR (middle); and the neutron density distribution (bottom).
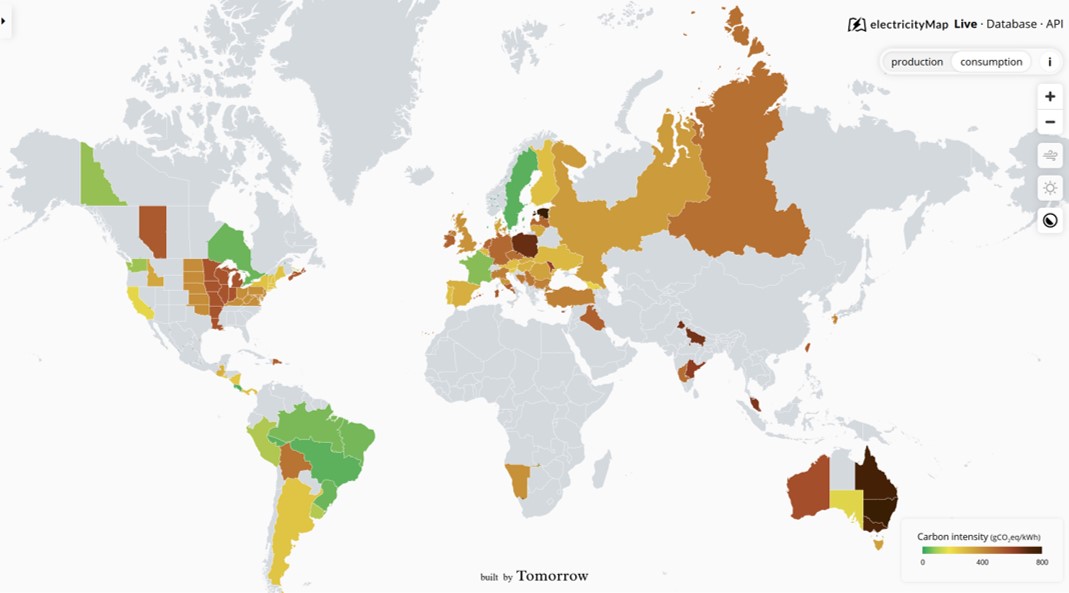 Second, a great app for your phone called electricityMap that shows you a live map of global carbon emissions and when you click on a country it reveals the sources of electricity by type, i.e. nuclear, gas, wind etc, as well as imports and exports of electricity. Dame Sue Ion told us about it during her key-note lecture. I think all politicians and journalists need it installed on their phones to check their facts before they start talking about energy policy.
 Third, the scale of the concrete infrastructure required in current designs of nuclear power stations compared to the reactor vessel where the energy is generated. The pictures show the construction site for the Vogtle nuclear power station in Georgia, USA (left) and the reactor pressure vessel being lowered into position (right). The scale of nuclear power stations was one of the reasons highlighted by Steve Smith from Algometrics for why investors are not showing much interest in them (see ‘Small is beautiful and affordable in nuclear power-stations‘ on January 14th, 2015). Amongst the other reasons are: too expensive (about £25 billion), too long to build (often decades), too back-end loaded (i.e. no revenue until complete), too complicated (legally, economically & socially), too uncertain politically, too toxic due to poor track record of returns to investors, too opaque in terms of management of industry. That’s quite a few challenges for the next generation of nuclear scientists and engineers to tackle. We are making a start by creating design tools that will enable mass-production of nuclear power stations (see ‘Enabling or disruptive technology for nuclear engineering?‘ on January 28th, 2015) following the processes used to produce other massive engineering structures, such as the Airbus A380 (see Integrated Digital Nuclear Design Programme); but the nuclear industry has to move fast to catch up with other sectors of the energy business, such as gas-fired powerstations or wind turbines. If it were to succeed then the energy market would be massively transformed.