Category Archives: structures

Did cubism inspire engineering analysis?

Bottle and Fishes c.1910-2 Georges Braque 1882-1963 Purchased 1961 http://www.tate.org.uk/art/work/T00445

Bottle and Fishes c.1910-2 Georges Braque 1882-1963 Purchased 1961 http://www.tate.org.uk/art/work/T00445

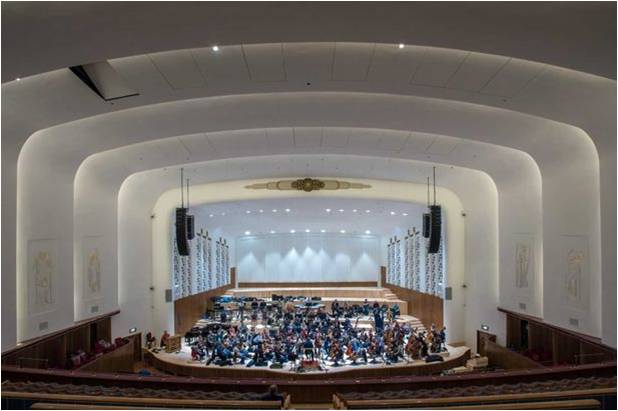
A few weeks ago we went to the Tate Liverpool with some friends who were visiting from out of town. It was my second visit to the gallery in as many months and I was reminded that on the previous visit I had thought about writing a post on a painting called ‘Bottle and Fishes’ by the French artist, Georges Braque.  It’s an early cubist painting – the style was developed by Picasso and Braque at the beginning of the last century.  The art critic, Louis Vauxcelles coined the term ‘cubism’ on seeing some of Braque’s paintings in 1908 and describing them as reducing everything to ‘geometric outlines, to cubes’.  It set me thinking about how long it took the engineering world to catch on to the idea of reducing objects, or components and structures, to geometric outlines and then into cubes.  This is the basis of finite element analysis, which was not invented until about fifty years after cubism, but is now ubiquitous in engineering design as the principal method of calculating deformation and stresses in components and structures.  An engineer can calculate the stresses in a simple cube with a pencil and paper, so dividing a structure into a myriad of cubes renders its analysis relatively straightforward but very tedious.  Of course, a computer removes the tedium and allows us to analyse complex structures relatively quickly and reliably.

So, why did it take engineers fifty years to apply cubism?  Well, we needed computers sufficiently powerful to make it worthwhile and they only became available after the Second War World due to the efforts of Turing and his peers.  At least, that’s our excuse!  Nowadays the application of finite element analysis extends beyond stress fields to many field variables, including heat, fluid flow and magnetic fields.

Can you trust your digital twin?

Author's digital twin?

Author’s digital twin?

There is about a 3% probability that you have a twin. About 32 in 1000 people are one of a pair of twins.  At the moment an even smaller number of us have a digital twin but this is the direction in which computational biomedicine is moving along with other fields.  For instance, soon all aircraft will have digital twins and most new nuclear power plants.  Digital twins are computational representations of individual members of a population, or fleet, in the case of aircraft and power plants.  For an engineering system, its computer-aided design (CAD) is the beginning of its twin, to which information is added from the quality assurance inspections before it leaves the factory and from non-destructive inspections during routine maintenance, as well as data acquired during service operations from health monitoring.  The result is an integrated model and database, which describes the condition and history of the system from conception to the present, that can be used to predict its response to anticipated changes in its environment, its remaining useful life or the impact of proposed modifications to its form and function. It is more challenging to create digital twins of ourselves because we don’t have original design drawings or direct access to the onboard health monitoring system but this is being worked on. However, digital twins are only useful if people believe in the behaviour or performance that they predict and are prepared to make decisions based on the predictions, in other words if the digital twins possess credibility.  Credibility appears to be like beauty because it is in eye of the beholder.  Most modellers believe that their models are both beautiful and credible, after all they are their ‘babies’, but unfortunately modellers are not usually the decision-makers who often have a different frame of reference and set of values.  In my group, one current line of research is to provide metrics and language that will assist in conveying confidence in the reliability of a digital twin to non-expert decision-makers and another is to create methodologies for evaluating the evidence prior to making a decision.  The approach is different depending on the extent to which the underlying models are principled, i.e. based on the laws of science, and can be tested using observations from the real world.  In practice, even with principled, testable models, a digital twin will never be an identical twin and hence there will always be some uncertainty so that decisions remain a matter of judgement based on a sound understanding of the best available evidence – so you are always likely to need advice from a friendly engineer   🙂

Sources:

De Lange, C., 2014, Meet your unborn child – before it’s conceived, New Scientist, 12 April 2014, p.8.

Glaessgen, E.H., & Stargel, D.S., 2012, The digital twin paradigm for future NASA and US Air Force vehicles, Proc 53rd AIAA/ASME/ASCE/AHS/ASC Structures, Structural Dynamics and Materials Conference, AIAA paper 2012-2018, NF1676L-13293.

Patterson E.A., Feligiotti, M. & Hack, E., 2013, On the integration of validation, quality assurance and non-destructive evaluation, J. Strain Analysis, 48(1):48-59.

Patterson, E.A., Taylor, R.J. & Bankhead, M., 2016, A framework for an integrated nuclear digital environment, Progress in Nuclear Energy, 87:97-103.

Patterson EA & Whelan MP, 2016, A framework to establish credibility of computational models in biology, Progress in Biophysics & Molecular Biology, doi: 10.1016/j.pbiomolbio.2016.08.007.

Tuegel, E.J., 2012, The airframe digital twin: some challenges to realization, Proc 53rd AIAA/ASME/ASCE/AHS/ASC Structures, Structural Dynamics and Materials Conference.

Recognizing strain

rlpoYou can step off an express train but you can’t speed up a donkey. This is paraphrased from ‘The Fly Trap’ by Fredrik Sjöberg in the context of our adoption of faster and faster technology and the associated life style. Last week we stepped briefly off the ‘express train’ and lowered our strain levels by going to a concert given by the Royal Liverpool Philharmonic Orchestra, including pieces by Dvorak, Chopin and Tchaikovsky. I am not musical at all and so I am unable to tell you much about the performances or compositions, except to say that I enjoyed the performances as did the rest of the audience to judge from the enthusiastic applause. A good deal of my enjoyment arose from the energy of the orchestra and my ability to recognise the musical themes or acoustic features in the pieces. The previous sentence was not intended as a critic’s perspective on the concert but a tenuous link…

Recognising features is one aspect of my recent research, though in strain data rather than music. Modern digital technology allows us to acquire information-rich data maps with tens of thousands of individual data values arranged in arrays or matrices, in which it can be difficult to spot patterns or features. We treat our strain data as images and use image decomposition to compress a data matrix into a feature vector. The diagram shows the process of image decomposition, in which a colour image is converted to a map of intensity in the image. The intensity values can be stored in a matrix and we can fit sets of polynomials to them by ‘tuning’ the coefficients in the polynomials. The coefficients are gathered together in a feature vector. The original data can be reconstructed from the feature vector if you know the set of polynomials used in the decomposition process, so decomposition is also a form of data compression. It is easier to recognise features in the small number of coefficients than in the original data map, which is why we use the process and why it was developed to allow computers to perform pattern recognition tasks such as facial recognition.

decompositionSources:

Wang W, Mottershead JE, Patki A, Patterson EA, Construction of shape features for the representation of full-field displacement/strain data, Applied Mechanics and Materials, 24-25:365-370, 2010.

Patki, A.S., Patterson, E.A, Decomposing strain maps using Fourier-Zernike shape descriptors, Exptl. Mech., 52(8):1137-1149, 2012.

Nabatchian A., Abdel-Raheem E., and Ahmadi M., 2008, Human face recognition using different moment invariants: a comparative review. Congress on Image and Signal Processing, 661-666.


Forensic engineering

Picture1The picture above shows the fracture surface of a thin bar of aluminium alloy that had a circular hole through the middle, like the peep-hole in a front door. The photograph was taken in a Scanning Electron Microscope (SEM) at x160 magnification. There is a scale bar in the bottom right corner showing a length of 100 microns. We are looking approximately in the longitudinal direction, which was the direction of loading, and across the photograph from left to right corresponds to the direction you would look through the hole. The lower one third of the picture shows the machined surface of the hole cut or machined by the drill. The top two-thirds shows the surface created by the fatigue crack as it extended incrementally with each cycle of load. The crack started from edge of the machined surface approximately on the vertical centre-line of the picture. I can tell this because all of the features in the texture of the fracture surface point towards this point because the failure radiated out from this location. The picture below shows the crack initiation area at x1000 magnification. It is a small area at interface with hole above the letters ‘SS40’ in the top photograph; this should be enough to let you identify the common features but the interpretation of these images requires significant skill.

Fractography is the forensic study of failure surfaces such as this to establish the cause of failure. In this example, the hole in aluminium bar ensured that it will always fail with cyclic loading through the growth of a crack from somewhere around the hole. The textured form of the fracture surface occurs because the material is not homogeneous at this scale but made up of small grains. The failure of each grain is influenced by its orientation to the loading which results in the multi-faceted surface in the photographs.

I made the photographs the focus of this post because I thought they are interesting, but may be that’s because I’m an engineer, and because they are a tiny part in a fundamental research programme on which I have been spending a significant portion of my time. A goal of programme is to understand how to use these materials to build more energy-efficient structures that are cheaper and last longer without failing by, for example, fatigue.

More details:

The bar was 1.6mm thick and 38mm wide in the transverse direction and made from 2024-T3 Aluminium alloy. The hole diameter was 6.36mm. A tension load was repeatedly applied and removed in the longitudinal direction which caused the initiation and growth of a fatigue crack from the hole that after many cycles of loading led to the bar breaking in half along a plane perpendicular to the load direction. The pictures were taken at the University of Plymouth by Khurram Amjad with the assistance of Peter Bond and Roy Moate using a JEOL JSM-6610LV.

x1000