Tag Archives: sustainability

A startling result

cowIn UK universities this is the season of project report writing for senior undergraduate students and report reading for their professors.   This year one of my students has been monitoring his personal ecological footprint and looking at ways in which he could use technology-based solutions to reduce it and then make recommendations to help others achieve the same [see my postings ‘Are we all free riders‘ on April 6th, 2016  ‘New Year Resolution‘ on December 31st, 2014].  He found that his weekly contributions to greenhouse gases (GHG) due to energy consumption in his flat or apartment, transportation and consumption of meat were 12.73, 5.87 & 8.60 kg carbon dioxide equivalents per week.  The total of 27.2 kg carbon dioxide equivalents per week is relatively low compared to the UK average but then he does not own a car and is living on a small budget.  What startled me was the proportion of greenhouse gases generated as a result of eating meat!

He consumed about 1.2kg of meat each week in about equal proportions of beef (12.14 kgCO2e/kg), chicken (2.84 kgCO2e/kg) and pork (4.45 kgCO2e/kg).  The numbers in parentheses are the greenhouse gas emissions from the production of each of these commodities in the UK and they can be compared to green beens or wheat at 1.55 and  0.52 kgCO2e/kg) respectively.  So, you don’t need to become a vegetarian but you could follow the example of my student by dropping beef from your diet in order to  make a significant individual contribution to reducing GHG emissions, or you could become a weekday vegetarian (see Graham Hill’s TED talk).

BTW – the diary cows, like the one in the picture, are lovely calm creatures and milk has a relatively small footprint at 1.19 kgCO2e/kg

Sources:
How low can we go? An assessment of greenhouse gas emissions from the UK food system end and the scope to reduce them by 2050. WWF November 2009.

Climate change and tides in Liverpool

image-20141201-20565-1eoo7rhIf you live within sight of the sea, as we do, then your life is probably influenced, to some degree, by the rise and fall of tides.  In Liverpool, we are lucky to have a particularly long historical record of tidal heights and one of my colleagues, an oceanographer, Professor Ric Williams has used this record to discuss climate variability.  The record was started and maintained between 1768 and 1793 by Captain William Hutchinson whose achievement is commemorated with a fountain in Liverpool’s historic docks, which are a UNESCO World Heritage Site.

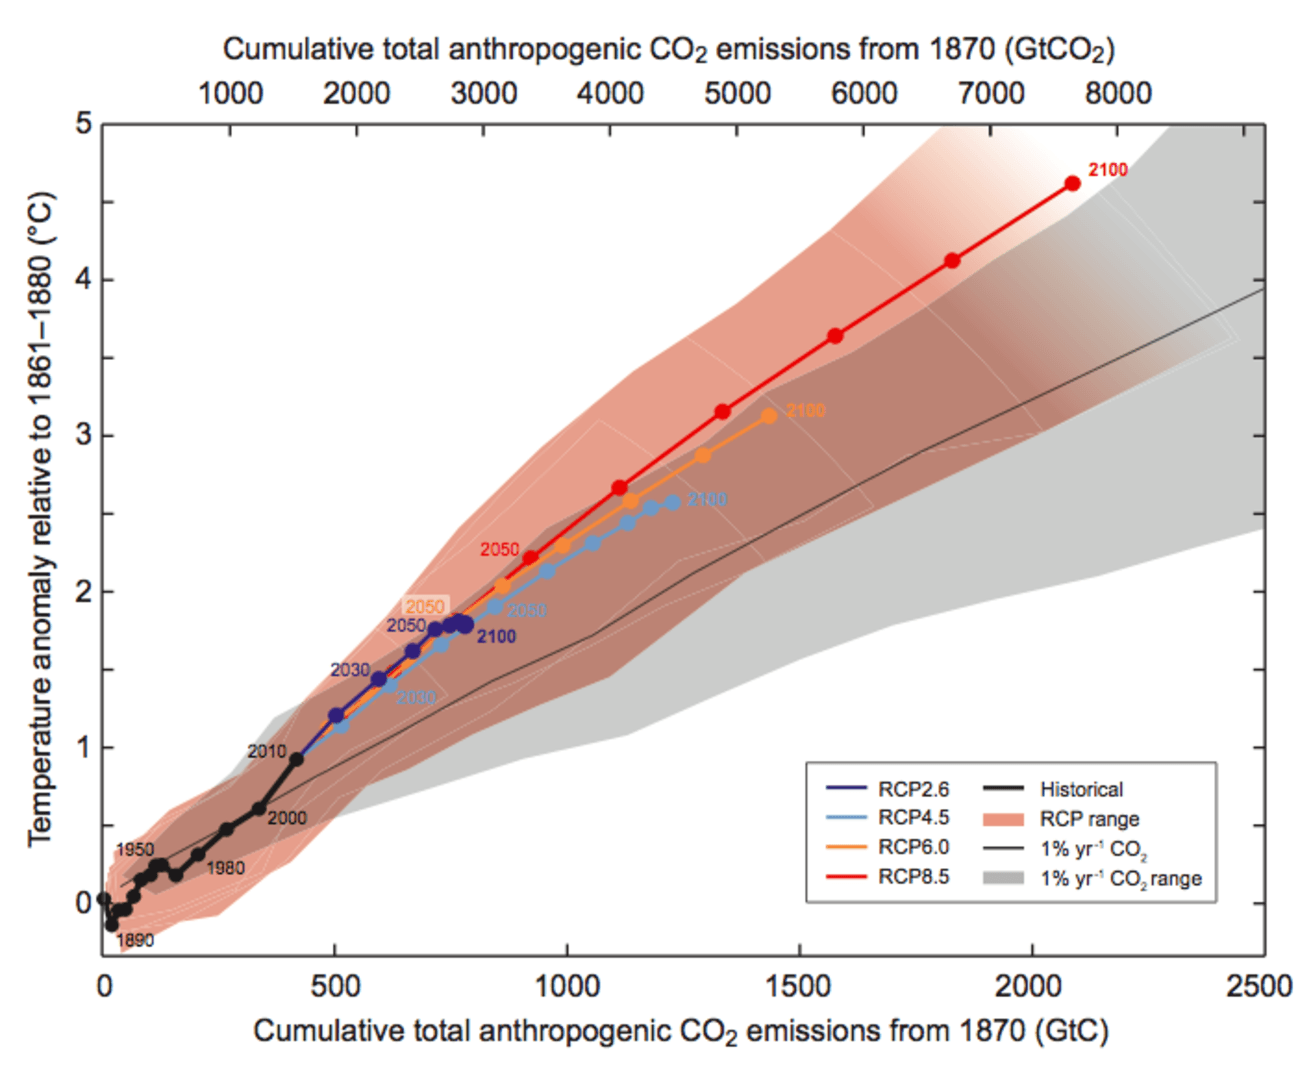
A few weeks ago I listened to a talk by Prof Williams, in which he described how there is a rather simple relationship between surface warming and the effect of future emissions of greenhouse gases.  If the predictions of surface warming are plotted as a function of how much carbon is emitted to the atmosphere, rather than time, then a simple response emerges: the more carbon we emit, the warmer it will get. Associated with the surface warming, there is an expected sea level rise from the expansion of the water column augmented by the effect of addition of freshwater from melting of land ice. Watch Prof Williams’ Youtube video to find out more.

Sources:

Woodworth, P.L. 1999. High waters at Liverpool since 1768: the UK’s longest sea level record. Geophysical Research Letters, 26 (11), 1589-1592.

Goodwin, P., Williams, R.G. & Ridgwell, A., Sensitivity of climate to cumulative carbon emissions dues to compensation of ocean heat and carbon uptake, Nature Geoscience, 8,29–34(2015).

Image: http://theconversation.com/our-equation-proves-climate-change-is-linked-to-emissions-34897


Opal offers validation opportunity for climate models

OrangeFanSpongeSmallMany of us will be familiar with the concept of the carbon cycle, but what about the silicon cycle?  Silicon is the second most abundant element in the Earth’s crust.  As a consequence of erosion, it is carried by rivers into the sea where organisms, such as sponges and diatoms (photosynthetic algae), convert the silicon in seawater into opal that ends up in ocean sediment when these organisms die.  This marine silicon cycle can be incorporated into climate models, since each step is influenced by climatic conditions, and the opal sediment distribution from deep sea sediment cores can be used for model validation.

This approach can assist in providing additional confidence in climate models, which are notoriously difficult to validate, and was described by Katharine Hendry, a Royal Society University Research Fellow at the University of Bristol at a recent conference at the Royal Society.  This struck me as an out-of-the box or lateral way of seeking to increase confidence in climate models.

There are many examples in engineering where we tend to shy away from comprehensive validation of computational models because the acquisition of measured data seems too difficult and, or expensive.  We should take inspiration from sponges – by looking for data that is not necessarily the objective of the modelling but that nevertheless characterises the model’s behaviour.

Source:

Thumbnail: http://www.aquariumcreationsonline.net/sponge.html

Are we all free riders?

girl in smogThe ‘tragedy of the commons’ is an economic theory founded on the idea that when there is unregulated use of a shared resource then the rational consumer, acting independently and in their own interests, will maximise their consumption leading to the depletion or destruction of the resource.  For example, if there is no cost or limit to grazing sheep on common land then a rational shepherd would maximise their flock size in order to maximise profit.  Eventually, the commons’ ability to sustain the sheep is overwhelmed and it becomes a wasteland.  Are we all taking a free ride on the world’s ecosystem?  Our cars and houses freely pump out huge quantities of carbon dioxide that are overwhelming our ecosystem.  Most of us do nothing – either because we refuse to believe the evidence, or we believe it is not in our interests to act, or we don’t think it is our problem, or we don’t know what to do, or a combination of these excuses.

This might seem a low priority to you.  But, for the 40% of the world’s population that live in the five countries with the worst air quality, it is a high priority.  If you visit these countries, you experience days when it is difficult to breathe because the pollution is so bad and it is hard to read your smartphone because the air is so thick with particles.  We are all part of a single ecosystem on the planet, Gaia if you like, and we are joined to one another through a myriad of connections.  So we ignore this issue at our peril, or the peril of our grandchildren.

It seems unlikely that our leaders will take effective coordinated action and so grass roots action is needed as suggested by Kofi Annan.  Assess your carbon footprint now and think about ways to become carbon neutral.  If you want to find out the carbon footprint of your organization then the Carbon Trust has useful information and services.

Sources:

The Economist Pocket World in Figures 2015 edition, Profile Books Ltd, London 2014

Thumbnail: http://blogs-images.forbes.com/benjaminshobert/files/2015/01/China_Smog2-1940×1293.jpg