Tag Archives: experimental mechanics

Insidious damage

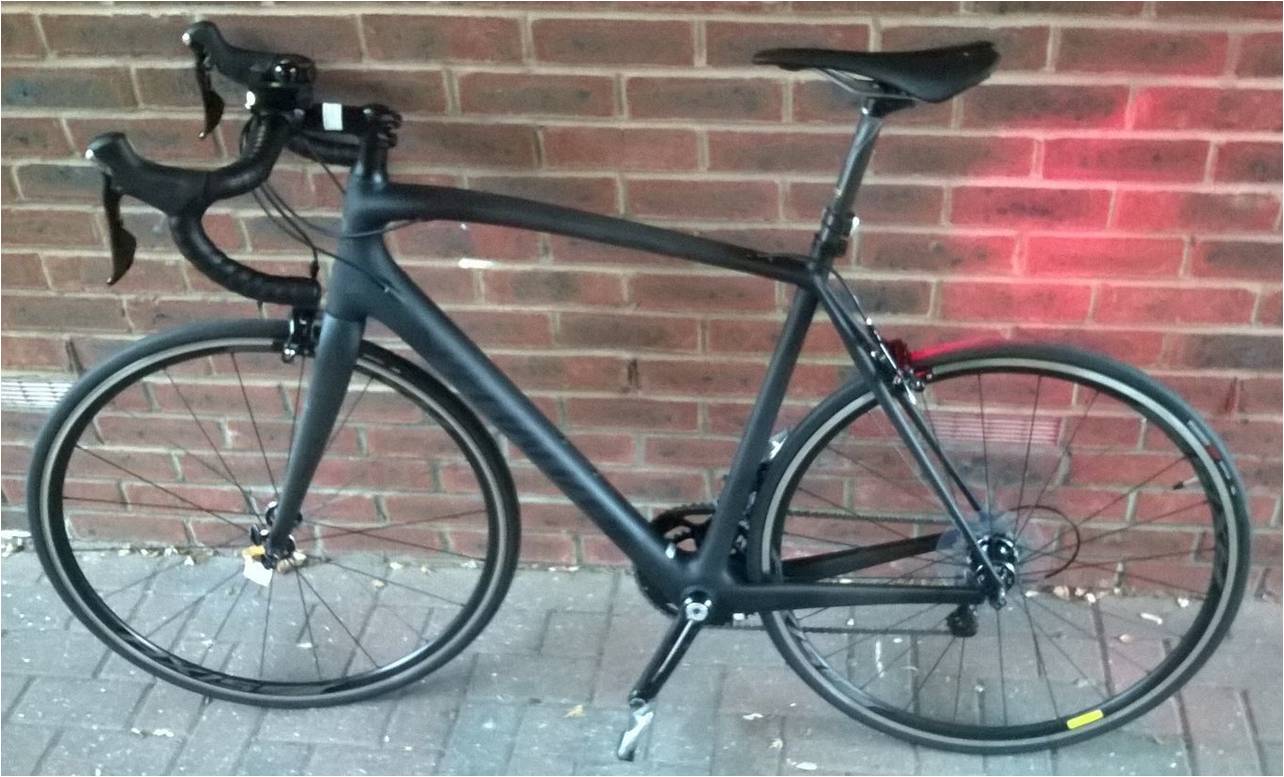
bikeRecently, my son bought a carbon-fibre framed bike for his commute to work. He talked to me about it before he made the decision to go ahead because he was worried about the susceptibility of carbon-fibre to impact damage. The aircraft industry worries about barely visible impact damage (BVID) because while the damage might be barely visible on the accessible face that received the impact, within the carbon-fibre component there can be substantial life-shortening damage. I reassured my son that it is unlikely a road bike would receive impacts of sufficient energy to induce life-shortening damage, at least in ordinary use. However, such impacts are not unusual in aircraft structures which means that they have to be inspected for hidden, insidious damage. The most common method of inspection is based on ultrasound that is reflected preferentially by the damaged areas so that the shape and extent of damage can be mapped. It is difficult to predict the effect on the structural performance of the component from this morphology information so that, when damage is found, the component is usually repaired or replaced immediately. In my research group we have been exploring the use of strain measurements to locate and assess damage by comparing the strain distributions in as-manufactured and in-service components. We can measure the strain fields in components using a number of techniques including digital image correlation (see my post entitled ‘256 shades of grey’) and thermoelastic stress analysis (see my post entitled ‘Counting photons to measure stress‘). The comparison is performed using feature vectors that represent the strain fields, see my post of a few weeks ago entitled ‘Recognising strain’. The guiding principle is that if damage is present but does not change the strain field then the structural performance of the component is unchanged; however when the strain field is changed then it is easier to predict remanent life from strain data than from morphology data. We have demonstrated that these new concepts work in glass-fibre reinforced laminates and are in the process of reproducing the results in carbon-fibre composites.

Sources

Patterson, E.A., Feligiotti, M., Hack, E., 2013, On the integration of validation, quality assurance and non-destructive evaluation, J. Strain Analysis, 48(1):48-59.

Patki, A.S., Patterson, E.A., 2012, Damage assessment of fibre reinforced composites using shape descriptors, J. Strain Analysis, 47(4):244-253.

Counting photons to measure stress

TSA pattern around a crack propagating from the left with its tip in the centre.

TSA pattern around a crack propagating from the left with its tip in the centre.

Some might find it strange that I am teaching thermodynamics when my research expertise is in structural materials and mechanics. However, the behaviour of structures is largely controlled by energy and how they absorb, store and release it; while thermodynamics is the study of energy flows and transformations, so there is a connection. In my research group, we exploit this connection in a technique for measuring stress fields in components by monitoring the temperature changes that occur when a component is loaded. In Thermoelastic Stress Analysis (TSA) as it is known, we use very sensitive infrared cameras to monitor the cyclic variations of temperature that occur when cyclic load is applied to a material. The temperature changes are of the order of milli-Kelvin, that’s thousandths of a degree, and are positive with negative, or compressive stress and negative with tensile stress. What we are actually measuring is the rate of change in the release of photons by atoms as they are pushed closer together in compression or pulled further apart in tension; but that’s another story and takes us into physics.

An exciting feature of this technique is that as a crack evolves new surfaces are formed which releases energy as heat. We can detect not only the stress field around the crack but also the heat released during the formation of the crack prior it being visible and its subsequent growth.

Sources:

Greene, R.J., Patterson, E.A., Rowlands, R.E., 2008, ‘Thermoelastic stress analysis’, in Handbook of Experimental Mechanics edited by W.N. Sharpe Jr., Springer, New York.

Yang, Y., Crimp, M., Tomlinson, R.A., Patterson, E.A., 2012, Quantitative measurement of plastic strain field at a fatigue crack tip, Proc. R. Soc. A., 468(2144):2399-2415.

Patki, A.S., Patterson, E.A., 2010, ‘Thermoelastic stress analysis of fatigue cracks subject to overloads’, Fatigue and Fracture of Engineering Materials and Structures, 33(12):809-821.


Cow bladders led to modern strain measurement


softball figureSir David Brewster was a prolific experimentalist who published seven papers in the Philosophical Transactions of the Royal Society during 1815 and 1816. In his report dated October 22nd, 1814 that was published by the Royal Society one hundred years ago in January 1815, he described his observations on the depolarisation in more than fifty materials as diverse as sulphur and the bladder of a cow. He followed this with a series of experiments on glass sheets subject to various loads and reported his observations in the of photographic plates that show photoelastic fringe patterns which would become instantly recognisable to generations of engineers. Two hundred year later, digital technology has revolutionised photoelasticity so that it is no longer necessary to generate fringes that can be ‘seen’, as in Brewster’s experiments. Instead, digital sensors allow us to measure changes in light intensity that are undetectable to the naked eye and digital computers permit the processing of arrays of tens of thousands of measurements in less than the blink of an eye to yield maps of strain magnitude and direction in complex components. However, the principles employed in digital photoelasticity are the same as those first elucidated by Brewster and involve collecting images at multiple rotational steps of one or more of the polarising elements in a polariscope and then using Fourier analysis or matrix algebra to solve the equations describing the stress-optic law, i.e. the relationship between the applied stress and the observed change in transmitted light intensity. A polariscope is the term given to the series of polarisers and quarter-waveplates used by almost every photoelastician since Brewster to observe photoelastic fringes. One of Brewster’s other great inventions was the kaleidoscope of which there is an early example in the Science Museum in London. Recently, the concept of the kaleidoscope has been combined with a polariscope to create the poleidoscope that allows the multiple images required for digital photoelasticity to be acquired simultaneously, which is useful for dynamic applications such as in the impact example shown in the picture. These advances allow digital photoelasticity to be used not only by laboratory-based stress analysts but also in quality assurance procedures, for instance to monitor in real-time the stresses induced in float glass during production, or to investigate the residual stress in silicon wafers using infra-red light.

The picture shows a sequence of maps of photoelastic fringe order (right) showing the stress induced in an epoxy resin block when impacted by a soft ball falling under gravity (left). The maps were obtained using a precursor to the poleidoscope and a high-speed digital camera recording 4000 frames per second for the 10x10mm area shown by the white box in the schematic.

For more a little more on photoelasticity see http://www.experimentalstress.com/basic_experimental_mechanics/photoelasticity.htm

Sources:

Brewster, D., Experiments on the depolarisation of light as exhibited by various mineral, animal , and vegetable bodies, with a reference of the phenomena to the general principles of polarisation, Phil. Trans. R. Soc. Lond. 105:29-53, 1815. http://rstl.royalsocietypublishing.org/content/105/29.full.pdf+html

Brewster, D., On the communication of the structure of doubly refracting crystals to glass, muriate of soda, fluor spar, and other substances by mechanical compression and dilatation, Phil. Trans. R. Soc. Lond. 106:156-178, 1816. http://rstl.royalsocietypublishing.org/content/106/156.full.pdf+html

Ramesh, K., Kasimayan, T., Neethi Simon, B., Digital photoelasticity – a comprehensive review, J. Strain Analysis, 46(4):245-266, 2011. http://sdj.sagepub.com/content/46/4/245.abstract

www.sciencemuseum.org.uk/online_science/explore_our_collections/objects/index/smxg-3823?agent=smxg-52657

Lesniak, J.R., Zhang, S.J., Patterson, E.A., The design and evaluation of the poleidoscope: a novel digital polariscope, Experimental Mechanics, 44(2):128-135, 2004.

Hobbs, J.W., Greene, R.J., Patterson, E.A., 2003, A novel instrument for transient photoelasticity, Experimental Mechanics, 43(4):403-409, 2003.

Seeing the invisible

Track of the Brownian motion of a 50 nanometre diameter particle

Track of the Brownian motion of a 50 nanometre diameter particle in a fluid.

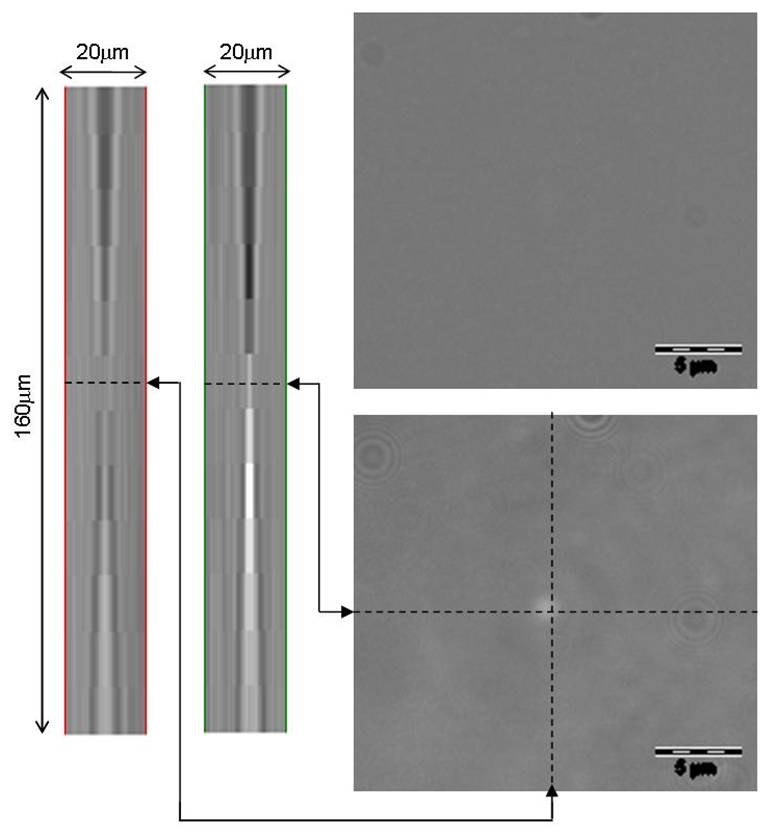
Nanoparticles are being used in a myriad of applications including sunscreen creams, sports equipment and even to study the stickiness of snot!  By definition, nanoparticles should have one dimension less than 100 nanometres, which is one thousandth of the thickness of a human hair.  Some nanoparticles are toxic to humans and so scientists are studying the interaction of nanoparticles with human cells.  However, a spherical nanoparticle is smaller than the wavelength length of visible light and so is invisible in a conventional optical microscope used by biologists.  We can view nanoparticles using a scanning electron microscope but the electron beam damages living cells so this is not a good solution.  An alternative is to adjust an optical microscope so that the nanoparticles produce caustics [see post entitled ‘Caustics’ on October 15th, 2014] many times the size of the particle.  These ‘adjustments’ involve closing an aperture to produce a pin-hole source of illumination and introducing a filter that only allows through a narrow band of light wavelengths.  An optical microscope adjusted in this way is called a ‘nanoscope’ and with the addition of a small oscillator on the microscope objective lens can be used to track nanoparticles using the technique described in last week’s post entitled ‘Holes in liquid‘.

The smallest particles that we have managed to observe using this technique were gold particles of diameter 3 nanometres , or about 1o atoms in diameter dispersed in a liquid.


Image of 3nm diameter gold particle in a conventional optical microscope (top right), in a nanoscope (bottom right) and composite images in the z-direction of the caustic formed in the nanoscope (left).

Image of 3nm diameter gold particle in a conventional optical microscope (top right), in a nanoscope (bottom right) and composite images in the z-direction of the caustic formed in the nanoscope (left).

Sources:

http://ihcp.jrc.ec.europa.eu/our_activities/nanotechnology/jrc-scientists-develop-a-technique-for-automated-three-dimensional-nanoparticle-tracking-using-a-conventional-microscope

‘Scientists use gold nanoparticles to study the stickiness of snot’ by Rachel Feldman in the Washington Post on October 9th, 2014.

J.-M. Gineste, P. Macko, E.A. Patterson, & M.P. Whelan, Three-dimensional automated nanoparticle tracking using Mie scattering in an optical microscope, Journal of Microscopy, Vol. 243, Pt 2 2011, pp. 172–178

Patterson, E.A., & Whelan, M.P., Optical signatures of small nanoparticles in a conventional microscope, Small, 4(10): 1703-1706, 2008.