Tag Archives: MyResearch

Forensic engineering

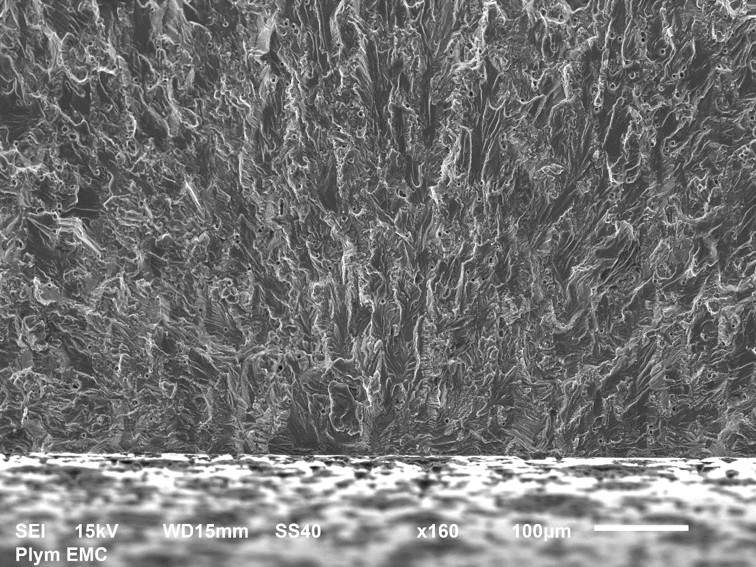
Picture1The picture above shows the fracture surface of a thin bar of aluminium alloy that had a circular hole through the middle, like the peep-hole in a front door. The photograph was taken in a Scanning Electron Microscope (SEM) at x160 magnification. There is a scale bar in the bottom right corner showing a length of 100 microns. We are looking approximately in the longitudinal direction, which was the direction of loading, and across the photograph from left to right corresponds to the direction you would look through the hole. The lower one third of the picture shows the machined surface of the hole cut or machined by the drill. The top two-thirds shows the surface created by the fatigue crack as it extended incrementally with each cycle of load. The crack started from edge of the machined surface approximately on the vertical centre-line of the picture. I can tell this because all of the features in the texture of the fracture surface point towards this point because the failure radiated out from this location. The picture below shows the crack initiation area at x1000 magnification. It is a small area at interface with hole above the letters ‘SS40’ in the top photograph; this should be enough to let you identify the common features but the interpretation of these images requires significant skill.

Fractography is the forensic study of failure surfaces such as this to establish the cause of failure. In this example, the hole in aluminium bar ensured that it will always fail with cyclic loading through the growth of a crack from somewhere around the hole. The textured form of the fracture surface occurs because the material is not homogeneous at this scale but made up of small grains. The failure of each grain is influenced by its orientation to the loading which results in the multi-faceted surface in the photographs.

I made the photographs the focus of this post because I thought they are interesting, but may be that’s because I’m an engineer, and because they are a tiny part in a fundamental research programme on which I have been spending a significant portion of my time. A goal of programme is to understand how to use these materials to build more energy-efficient structures that are cheaper and last longer without failing by, for example, fatigue.

More details:

The bar was 1.6mm thick and 38mm wide in the transverse direction and made from 2024-T3 Aluminium alloy. The hole diameter was 6.36mm. A tension load was repeatedly applied and removed in the longitudinal direction which caused the initiation and growth of a fatigue crack from the hole that after many cycles of loading led to the bar breaking in half along a plane perpendicular to the load direction. The pictures were taken at the University of Plymouth by Khurram Amjad with the assistance of Peter Bond and Roy Moate using a JEOL JSM-6610LV.
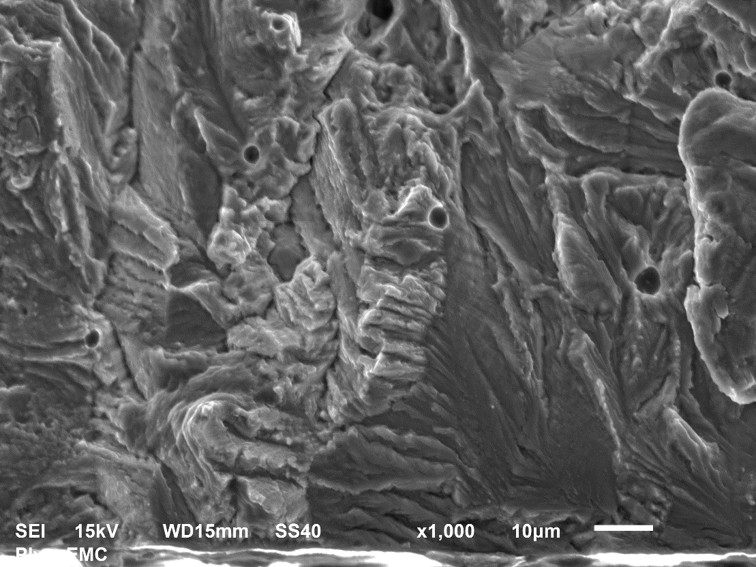
x1000

Enabling or disruptive technology for nuclear engineering?

INDEA couple of weeks ago [see ‘Small is beautiful and affordable in nuclear power-stations’  on January 14th, 2015] I ranted about the need to develop small modular reactors whose components can be mass-produced in a similar way to the wings, cockpit, tail-planes, fuselage and engines of an Airbus aeroplane that are manufactured in factories in different countries in Europe prior to final assembly and commissioning in Toulouse, France. The aerospace industry is heavily dependent on computer-aided engineering to design, test, manufacture, operate and maintain aircraft in a series of processes involving a huge number of organisations. The civil engineering and building services industries are following the same model through the introduction of BIM, or Building Information Modelling. I have recently suggested that the nuclear industry needs to adopt the same approach through an Integrated Nuclear Digital Environment (INDE) that has the potential to reduce operating and decommissioning costs and increase reliability and safety for existing and planned power-stations but more importantly would enable a move towards mass-production of modular power-stations.

Recently I presented a paper at a NAFEMS seminar on Modelling and Simulation in the Nuclear Industry held on November 19th 2014 in Manchester, UK.  To judge from the Q&A session afterwards, the paper divided the audience into those who could see the enormous potential (the enablers?) and those who saw only massive problems that rendered it unworkable (the potentially disrupted?). The latter group tends to cite the special circumstances of the nuclear industry associated with its risks and regulatory environment. These are important factors but are not unique to the industry. From my perspective of working with many other industrial sectors, the nuclear industry is unique in its slow progress in exploiting the potential of digital technologies.  Perhaps in the end, as one of my academic colleagues believes, research on solar power will produce such efficient solar cells that even in cold and cloudy England we will be able to meet all of our power needs from solar energy [given incoming solar radiation is about 340 Watts/square meter], in which case perhaps the nuclear power industry will become extinct unless it has evolved.

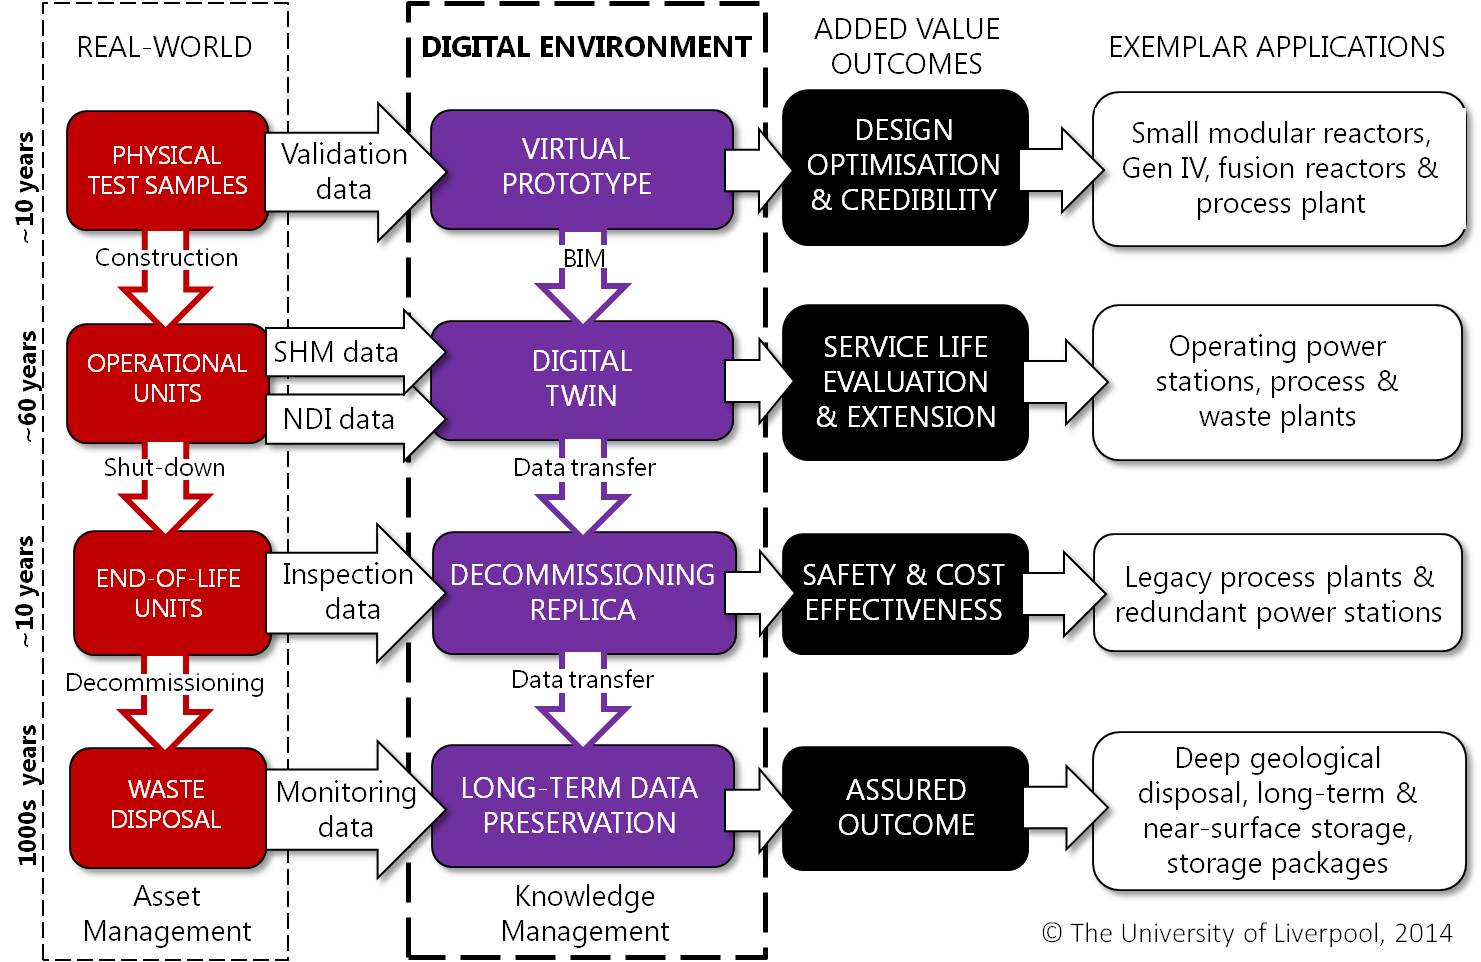
Schematic diagram showing the digital environment (second column from left in purple), its relationships to the real-world (left column in red) and the potential added value (third column from left) together with exemplar applications (right column). Coloured arrows are processes and coloured boxes represent physical (red) or digital (purple) infrastructure.

Schematic diagram showing the digital environment (second column from left in purple), its relationships to the real-world (left column in red) and the potential added value (third column from left) together with exemplar applications (right column). Coloured arrows are processes and coloured boxes represent physical (red) or digital (purple) infrastructure [from Patterson & Taylor, 2014].

The diagram is an extract from Patterson & Taylor, 2014.  The views expressed in this blog post are those of the author and not necessarily of those of his co-authors on other publications, or their employers.

Cow bladders led to modern strain measurement


softball figureSir David Brewster was a prolific experimentalist who published seven papers in the Philosophical Transactions of the Royal Society during 1815 and 1816. In his report dated October 22nd, 1814 that was published by the Royal Society one hundred years ago in January 1815, he described his observations on the depolarisation in more than fifty materials as diverse as sulphur and the bladder of a cow. He followed this with a series of experiments on glass sheets subject to various loads and reported his observations in the of photographic plates that show photoelastic fringe patterns which would become instantly recognisable to generations of engineers. Two hundred year later, digital technology has revolutionised photoelasticity so that it is no longer necessary to generate fringes that can be ‘seen’, as in Brewster’s experiments. Instead, digital sensors allow us to measure changes in light intensity that are undetectable to the naked eye and digital computers permit the processing of arrays of tens of thousands of measurements in less than the blink of an eye to yield maps of strain magnitude and direction in complex components. However, the principles employed in digital photoelasticity are the same as those first elucidated by Brewster and involve collecting images at multiple rotational steps of one or more of the polarising elements in a polariscope and then using Fourier analysis or matrix algebra to solve the equations describing the stress-optic law, i.e. the relationship between the applied stress and the observed change in transmitted light intensity. A polariscope is the term given to the series of polarisers and quarter-waveplates used by almost every photoelastician since Brewster to observe photoelastic fringes. One of Brewster’s other great inventions was the kaleidoscope of which there is an early example in the Science Museum in London. Recently, the concept of the kaleidoscope has been combined with a polariscope to create the poleidoscope that allows the multiple images required for digital photoelasticity to be acquired simultaneously, which is useful for dynamic applications such as in the impact example shown in the picture. These advances allow digital photoelasticity to be used not only by laboratory-based stress analysts but also in quality assurance procedures, for instance to monitor in real-time the stresses induced in float glass during production, or to investigate the residual stress in silicon wafers using infra-red light.

The picture shows a sequence of maps of photoelastic fringe order (right) showing the stress induced in an epoxy resin block when impacted by a soft ball falling under gravity (left). The maps were obtained using a precursor to the poleidoscope and a high-speed digital camera recording 4000 frames per second for the 10x10mm area shown by the white box in the schematic.

For more a little more on photoelasticity see http://www.experimentalstress.com/basic_experimental_mechanics/photoelasticity.htm

Sources:

Brewster, D., Experiments on the depolarisation of light as exhibited by various mineral, animal , and vegetable bodies, with a reference of the phenomena to the general principles of polarisation, Phil. Trans. R. Soc. Lond. 105:29-53, 1815. http://rstl.royalsocietypublishing.org/content/105/29.full.pdf+html

Brewster, D., On the communication of the structure of doubly refracting crystals to glass, muriate of soda, fluor spar, and other substances by mechanical compression and dilatation, Phil. Trans. R. Soc. Lond. 106:156-178, 1816. http://rstl.royalsocietypublishing.org/content/106/156.full.pdf+html

Ramesh, K., Kasimayan, T., Neethi Simon, B., Digital photoelasticity – a comprehensive review, J. Strain Analysis, 46(4):245-266, 2011. http://sdj.sagepub.com/content/46/4/245.abstract

www.sciencemuseum.org.uk/online_science/explore_our_collections/objects/index/smxg-3823?agent=smxg-52657

Lesniak, J.R., Zhang, S.J., Patterson, E.A., The design and evaluation of the poleidoscope: a novel digital polariscope, Experimental Mechanics, 44(2):128-135, 2004.

Hobbs, J.W., Greene, R.J., Patterson, E.A., 2003, A novel instrument for transient photoelasticity, Experimental Mechanics, 43(4):403-409, 2003.

Seeing the invisible

Track of the Brownian motion of a 50 nanometre diameter particle

Track of the Brownian motion of a 50 nanometre diameter particle in a fluid.

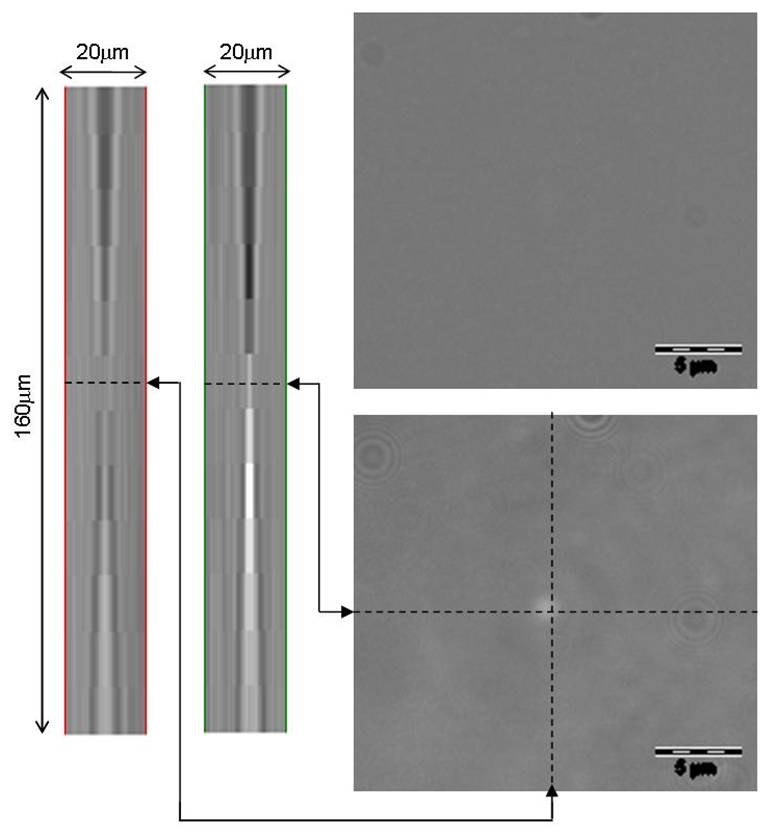
Nanoparticles are being used in a myriad of applications including sunscreen creams, sports equipment and even to study the stickiness of snot!  By definition, nanoparticles should have one dimension less than 100 nanometres, which is one thousandth of the thickness of a human hair.  Some nanoparticles are toxic to humans and so scientists are studying the interaction of nanoparticles with human cells.  However, a spherical nanoparticle is smaller than the wavelength length of visible light and so is invisible in a conventional optical microscope used by biologists.  We can view nanoparticles using a scanning electron microscope but the electron beam damages living cells so this is not a good solution.  An alternative is to adjust an optical microscope so that the nanoparticles produce caustics [see post entitled ‘Caustics’ on October 15th, 2014] many times the size of the particle.  These ‘adjustments’ involve closing an aperture to produce a pin-hole source of illumination and introducing a filter that only allows through a narrow band of light wavelengths.  An optical microscope adjusted in this way is called a ‘nanoscope’ and with the addition of a small oscillator on the microscope objective lens can be used to track nanoparticles using the technique described in last week’s post entitled ‘Holes in liquid‘.

The smallest particles that we have managed to observe using this technique were gold particles of diameter 3 nanometres , or about 1o atoms in diameter dispersed in a liquid.


Image of 3nm diameter gold particle in a conventional optical microscope (top right), in a nanoscope (bottom right) and composite images in the z-direction of the caustic formed in the nanoscope (left).

Image of 3nm diameter gold particle in a conventional optical microscope (top right), in a nanoscope (bottom right) and composite images in the z-direction of the caustic formed in the nanoscope (left).

Sources:

http://ihcp.jrc.ec.europa.eu/our_activities/nanotechnology/jrc-scientists-develop-a-technique-for-automated-three-dimensional-nanoparticle-tracking-using-a-conventional-microscope

‘Scientists use gold nanoparticles to study the stickiness of snot’ by Rachel Feldman in the Washington Post on October 9th, 2014.

J.-M. Gineste, P. Macko, E.A. Patterson, & M.P. Whelan, Three-dimensional automated nanoparticle tracking using Mie scattering in an optical microscope, Journal of Microscopy, Vol. 243, Pt 2 2011, pp. 172–178

Patterson, E.A., & Whelan, M.P., Optical signatures of small nanoparticles in a conventional microscope, Small, 4(10): 1703-1706, 2008.