Category Archives: everyday engineering examples

Everyday examples contribute to successful learning

Some weeks ago I quoted Adams and Felder [2008] who said that the ‘educational role of faculty [academic staff] is not to impart knowledge; but to design learning environments that support…knowledge acquisition’ [see ‘Creating an evolving learning environment’ on February 21st, 2018].  A correspondent asked how I create a learning environment and, in response, this is the first in a series of posts on the topic that will appear every third week.  The material is taken from a one-day workshop that Pat Campbell [of Campbell-Kibler Associates] and I have given periodically in the USA [supported by NSF ] and UK [supported by HEA] for engineering academics.

Albert Einstein is reputed to have said that ‘knowledge is experience, everything else is just information’.  I believe that a key task for a university teacher of engineering is to find the common experiences of their students and use them to illustrate engineering principles.  This is relatively straightforward for senior students because they will have taken courses or modules delivered by your colleagues; however, it is more of a challenge for students entering the first year of an engineering programme.  Everyone is unique and a product of their formative conditions, which makes it tricky to identify common experiences that can be used to explain engineering concepts.  The Everyday Engineering Examples, which feature on a page of this blog [https://realizeengineering.blog/everyday-engineering-examples/], were developed to address the need for illustrative situations that would fall into the experience of most, if not all, students.  Two popular examples are using the splits in sausages when you cook them to illustrate two-dimensional stress systems in pressure vessels [see lesson plan S11] and using a glass to extinguish a birthday candle on a cup cake to explain combustion processes [see lesson plan T11].

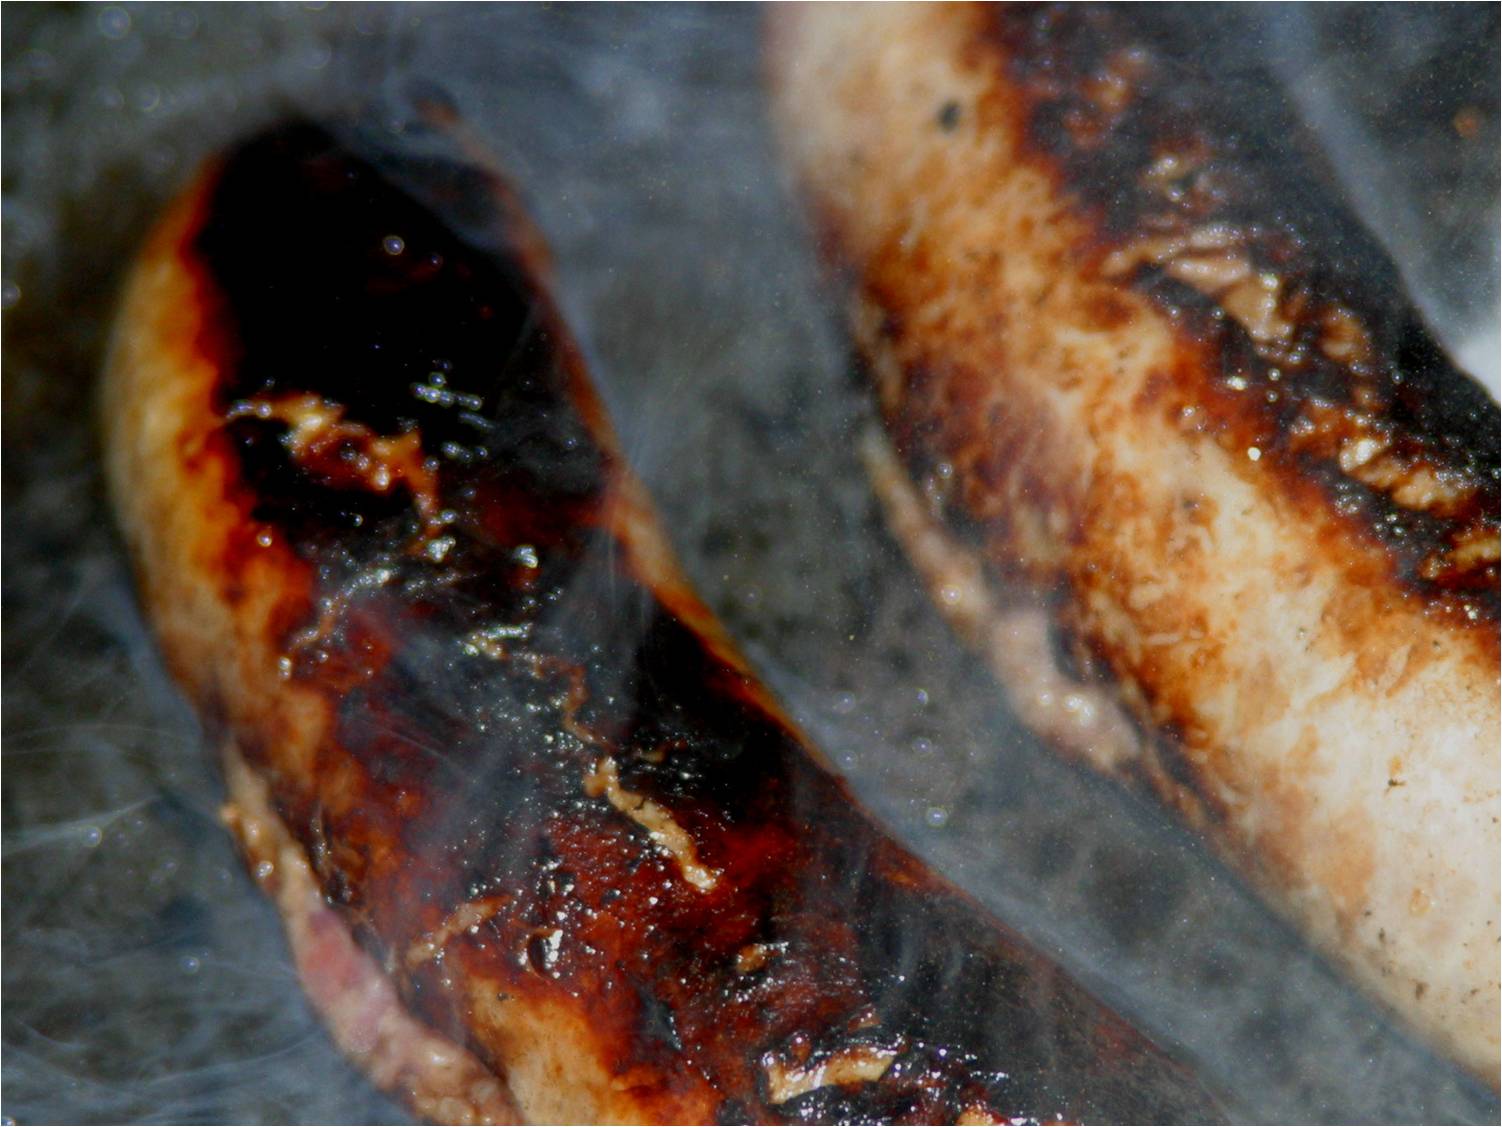
Everyday Engineering Examples were developed as part of an educational research project, which was funded by the US National Science Foundation [see ENGAGE] and demonstrated that this approach to teaching works.  The project found that significantly more students rated their learning with Everyday Engineering Examples as high or significant than in the control classes independent of the level of difficult involved [Campbell et al. 2008].  So, this is one way in which I create a learning en
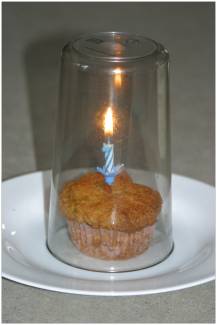
vironment that supports knowledge acquisition.  More in future posts…

References

Adams RS & Felder RM, Reframing professional development: A systems approach to preparing engineering educators to educate tomorrow’s engineers. J. Engineering Education, 97(3):230-240, 2008

Campbell PB, Patterson EA, Busch Vishniac I & Kibler T, Integrating Applications in the Teaching of Fundamental Concepts, Proc. 2008 ASEE Annual Conference and Exposition, (AC 2008-499), 2008


CALE #1 [Creating A Learning Environment: a series of posts based on a workshop given periodically by Pat Campbell and Eann Patterson in the USA supported by NSF and the UK supported by HEA]

How many repeats do we need?

This is a question that both my undergraduate students and a group of taught post-graduates have struggled with this month.  In thermodynamics, my undergraduate students were estimating absolute zero in degrees Celsius using a simple manometer and a digital thermometer (this is an experiment from my MOOC: Energy – Thermodynamics in Everyday Life).  They needed to know how many times to repeat the experiment in order to determine whether their result was significantly different to the theoretical value: -273 degrees Celsius [see my post entitled ‘Arbitrary zero‘ on February 13th, 2013 and ‘Beyond  zero‘ the following week]. Meanwhile, the post-graduate students were measuring the strain distribution in a metal plate with a central hole that was loaded in tension. They needed to know how many times to repeat the experiment to obtain meaningful results that would allow a decision to be made about the validity of their computer simulation of the experiment [see my post entitled ‘Getting smarter‘ on June 21st, 2017].

The simple answer is six repeats are needed if you want 98% confidence in the conclusion and you are happy to accept that the margin of error and the standard deviation of your sample are equal.  The latter implies that error bars of the mean plus and minus one standard deviation are also 98% confidence limits, which is often convenient.  Not surprisingly, only a few undergraduate students figured that out and repeated their experiment six times; and the post-graduates pooled their data to give them a large enough sample size.

The justification for this answer lies in an equation that relates the number in a sample, n to the margin of error, MOE, the standard deviation of the sample, σ, and the shape of the normal distribution described by the z-score or z-statistic, z*: The margin of error, MOE, is the maximum expected difference between the true value of a parameter and the sample estimate of the parameter which is usually the mean of the sample.  While the standard deviation, σ,  describes the difference between the data values in the sample and the mean value of the sample, μ.  If we don’t know one of these quantities then we can simplify the equation by assuming that they are equal; and then n ≥ (z*)².

The z-statistic is the number of standard deviations from the mean that a data value lies, i.e, the distance from the mean in a Normal distribution, as shown in the graphic [for more on the Normal distribution, see my post entitled ‘Uncertainty about Bayesian methods‘ on June 7th, 2017].  We can specify its value so that the interval defined by its positive and negative value contains 98% of the distribution.  The values of z for 90%, 95%, 98% and 99% are shown in the table in the graphic with corresponding values of (z*)², which are equivalent to minimum values of the sample size, n (the number of repeats).

Confidence limits are defined as: but when n = , this simplifies to μ ± σ.  So, with a sample size of six (6 = n   for 98% confidence) we can state with 98% confidence that there is no significant difference between our mean estimate and the theoretical value of absolute zero when that difference is less than the standard deviation of our six estimates.

BTW –  the apparatus for the thermodynamics experiments costs less than £10.  The instruction sheet is available here – it is not quite an Everyday Engineering Example but the experiment is designed to be performed in your kitchen rather than a laboratory.

Georgian interior design and efficient radiators

My lecture last week, to first year students studying thermodynamics, was about energy flows and, in particular, heat transfer.  I mentioned that, despite being called radiators, radiation from a typical central heating radiator represents less than a quarter of its heat output with rest arising from convection [see post entitled ‘On the beach‘ on July 24th, 2013 for an explanation of types of heat transfer].  This led one student to ask whether black radiators, with an emissivity of close to one, would be more efficient.  The question arises because the rate of radiative heat transfer is proportionate to the difference in the fourth power of the temperature of the radiator and its surroundings, and to the surface emissivity of the surface of the radiator.  This implies that heat will transfer more quickly from a hot radiator but also more slowly from a white radiator that has an emissivity of 0.05 compared to 1 for black surface.

Thus, a black radiator will radiator heat more quickly than a white one; but does that mean it’s more efficient?  The first law of thermodynamics demands that the nett energy input to a radiator is the same as the energy input required to raise the temperature of the space in which it is located.  Hence, the usual thermodynamic definition of efficiency, i.e. what we want divided by what we must supply, does not apply.  Instead, we usually mean the rate at which a radiator warms up a room or the size of the radiator required to heat the room.  In other words, a radiator that warms a room quickly is considered more efficient and a small radiator that achieves the same as large one is also considered efficient.  So, on this basis a black radiator will be more efficient.

Recent research by a team, at my alma mater, has shown that a rough black wall behind the radiator also increases its efficiency, especially when the radiator is located slightly away from the wall.  Perhaps, it is time for interior designers to develop a retro-Georgian look with dark walls, perhaps with sand mixed into the paint to increase surface roughness.

Sources:

Beck SMB, Grinsted SC, Blakey SG & Worden K, A novel design for panel radiators, Applied Thermal Engineering, 24:1291-1300, 2004.

Shati AKA, Blakey SG & Beck SBM, The effect of surface roughness and emissivity on radiator output, Energy and Buildings, 43:400-406, 2011.

Image details:

Verplank 2 002<br />
Working Title/Artist: Woodwork of a Room from the Colden HouseDepartment: Am. Decorative ArtsCulture/Period/Location: HB/TOA Date Code: Working Date: 1767<br />
Digital Photo File Name: DP210660.tif<br />
Online Publications Edited By Steven Paneccasio for TOAH 1/3/14

https://www.metmuseum.org/toah/works-of-art/40.127/

Steamy show

The Australian Academy of Technology and Engineering published a report sometime ago called ‘Technology is really a way of thinking‘.  They were right.  Once you become an engineer, then you can’t help looking at everything through the same ‘technology’ lens.  Let me give you an example.

A couple of weekends ago we went to see  ‘Anthony and Cleopatra‘ performed by the Royal Shakespeare Company in Stratford-upon-Avon.  It was a magnificient spectacle and a captivating performance, especially by Josette Simon as Cleopatra.  Before the performance started, we couldn’t help noticing the columns of steam forming in the auditorium from the ceiling downwards.  Initially, we thought that they were a stage effect creating an atmosphere in the theatre; but then I realised, it was ‘steam’ forming as the air-conditioning pushed cold air into the auditorium.  It’s the same effect that sometimes causes alarm on an aircraft, when it appears that smoke is billowing into the cabin prior to take-off.

The air in the theatre was a mixture of air and water vapour that was warm enough that the water was completely gaseous, and hence, invisible.  However, when the air-conditioning pumped cold air into the theatre, then the mixture of air and water was cooled to below the dew point of the water vapour causing it to condense into small droplets that were visible in the auditorium’s downlighters, forming the columns of ‘steam’.  Of course, the large mass of warm air in the auditorium quickly reheated the cold air, causing the droplets to evaporate and the columns of steam to disintegrate.  Most people just enjoyed the play; it’s just the technologists that were preoccupied with what caused the phenomenon!

If you want a more technical explanation, in terms of partial pressures and psychrometry, then there is an Everyday Engineering Example lesson plan available : 5E lesson plan T10 – psychrometric applications.

Picture: https://www.rsc.org.uk/shop/item/30200-anthony-and-cleopatra-poster-2017/