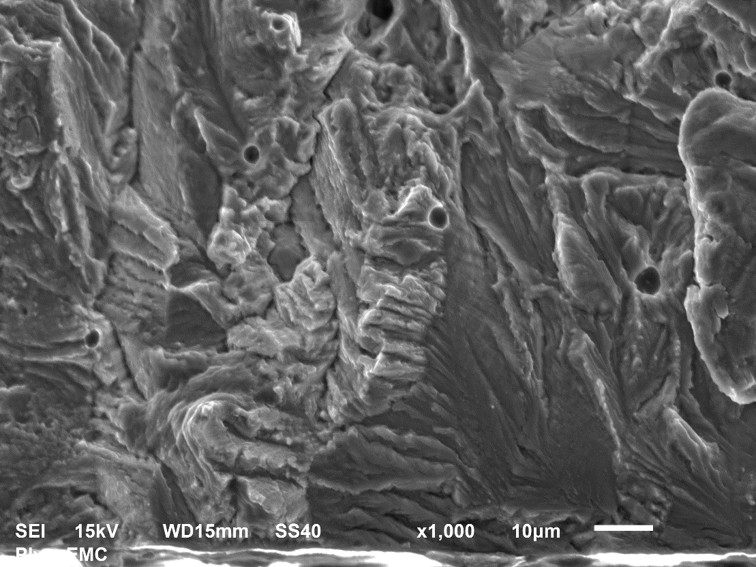
 The picture above shows the fracture surface of a thin bar of aluminium alloy that had a circular hole through the middle, like the peep-hole in a front door. The photograph was taken in a Scanning Electron Microscope (SEM) at x160 magnification. There is a scale bar in the bottom right corner showing a length of 100 microns. We are looking approximately in the longitudinal direction, which was the direction of loading, and across the photograph from left to right corresponds to the direction you would look through the hole. The lower one third of the picture shows the machined surface of the hole cut or machined by the drill. The top two-thirds shows the surface created by the fatigue crack as it extended incrementally with each cycle of load. The crack started from edge of the machined surface approximately on the vertical centre-line of the picture. I can tell this because all of the features in the texture of the fracture surface point towards this point because the failure radiated out from this location. The picture below shows the crack initiation area at x1000 magnification. It is a small area at interface with hole above the letters ‘SS40’ in the top photograph; this should be enough to let you identify the common features but the interpretation of these images requires significant skill.
Fractography is the forensic study of failure surfaces such as this to establish the cause of failure. In this example, the hole in aluminium bar ensured that it will always fail with cyclic loading through the growth of a crack from somewhere around the hole. The textured form of the fracture surface occurs because the material is not homogeneous at this scale but made up of small grains. The failure of each grain is influenced by its orientation to the loading which results in the multi-faceted surface in the photographs.
I made the photographs the focus of this post because I thought they are interesting, but may be that’s because I’m an engineer, and because they are a tiny part in a fundamental research programme on which I have been spending a significant portion of my time. A goal of programme is to understand how to use these materials to build more energy-efficient structures that are cheaper and last longer without failing by, for example, fatigue.
More details:
The bar was 1.6mm thick and 38mm wide in the transverse direction and made from 2024-T3 Aluminium alloy. The hole diameter was 6.36mm. A tension load was repeatedly applied and removed in the longitudinal direction which caused the initiation and growth of a fatigue crack from the hole that after many cycles of loading led to the bar breaking in half along a plane perpendicular to the load direction. The pictures were taken at the University of Plymouth by Khurram Amjad with the assistance of Peter Bond and Roy Moate using a JEOL JSM-6610LV.

 It is easy to become cynical about the latest innovation and the claims for its future success. The tendency becomes worse with age and the feeling that you’ve seen it all before. The IT consultancy firm, Gartner Inc. have invented a graph to describe the cycle of enthusiam, despondency and maybe ultimate productivity of new inventions. They call it the hype curve. For most new ideas the plateau of productivity is 5 to 10 years after the peak of inflated expectations and separated from it by a deep trough of disillusionment.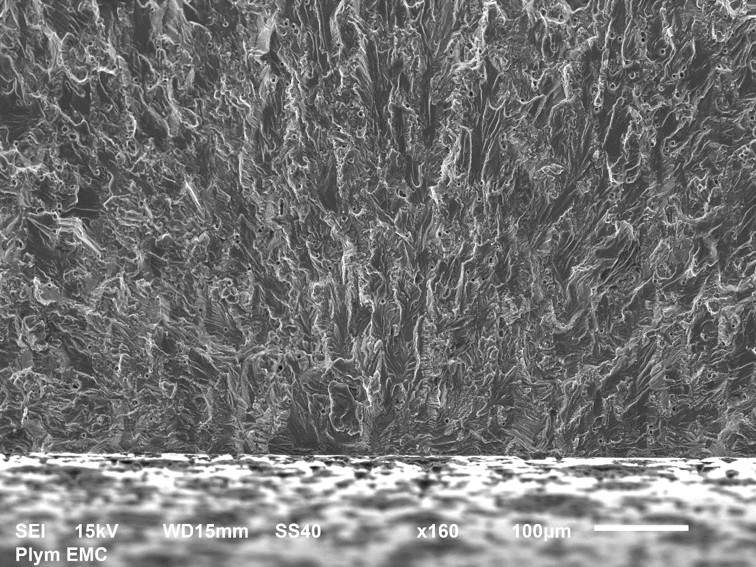


 Realize Engineering