Tag Archives: simulation

Setting standards

cenLast week I wrote about digital image correlation as a method for measuring surface strain and displacement fields.  The simplicity and modest cost of the equipment required combined with the quality and quantity of the results is revolutionizing the field of experimental mechanics.  It also has the potential to do the same in computational mechanics by enabling more comprehensive validation of models and thus enhancing the credibility and confidence in engineering simulations.  I have written and lectured on this topic many times, see for instance my post of September 17th, 2012 entitled ‘Model credibility’ or  http://sdj.sagepub.com/content/48/1.toc

At the moment, I am chair of a CEN workshop WS71 that is developing a precursor to a standard on validation of computational solid mechanics models.  To inform our deliberations, we have organised an Inter-Laboratory Study (ILS) to allow people to try out the proposed validation protocol and give us feedback.   If you would like to have a go then download the information pack.  You don’t need to do any experiments or modelling, just try the validation procedure with some of the data sets provided.  The more engineers that participate in the ILS then the better that the final CEN document is likely to be; so if you know someone who might be interested then forward this blog to them or just send them the link.

Displacement field measured using image correlation for metal wedge indenting a rubber block

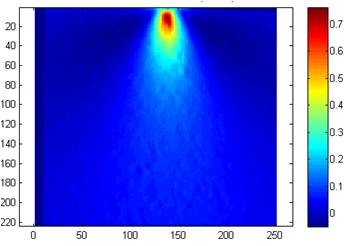
Displacement field measured using digital image correlation for a metal wedge indenting a rubber block

CEN WS71: http://www.cen.eu/cen/Sectors/TechnicalCommitteesWorkshops/Workshops/Pages/WS71VANESSA.aspx

EU FP7 project VANESSA: www.engineeringvalidation.org

For information on the data field shown to the right see: http://sdj.sagepub.com/content/49/2/112.abstract

256 shades of grey

bonnet panelEngineers are increasingly using digital photographs with 256 shades of grey to measure displacement of structural components.  The technique is known as Digital Image Correlation and is the most common way to measure the deformation of engineering structures and components in a laboratory, and increasingly in the field.  DIC provides maps of the displacement of the component surface from which the strain field can be calculated and which in turn allows engineers to assess the behaviour and likely failure modes of the component.  DIC is beginning to revolutionise the way in which we validate computational mechanics models.

DIC involves capturing ‘before’ and ‘after’ images of the component surface while load is applied.  If the surface has a random pattern, which is often created by spray-painting black speckles onto a white background, then it is possible to track the movement of the pattern as the surface moves and deforms.  The images are usually recorded as intensity maps defined by 256 shades of grey or grey levels from white through to black.  A mathematical signature is assigned to facets or sub-images of the intensity map in the ‘before’ image and a correlation algorithm uses the signature to recognise the facet in the ‘after’ image.  The positions of the centre of the facet in the ‘before’ and ‘after’ images indicates the displacement of the corresponding area of the component surface.  Two cameras can be used to provide stereoscopic vision and information on displacements in all directions.

The picture shows a car bonnet or hood panel in a test frame in a laboratory prior to an impact test with a random speckle pattern on the surface to allow DIC to be performed using high-speed cameras. For more details see: Burguete et al , 2013, J. Strain Analysis, doi:10.1177/0309324713498074 at http://sdj.sagepub.com/content/early/2013/09/19/0309324713498074.full.pdf+html

For detailed explanations of DIC try the monograph by Professor Mike Sutton and his colleagues [link.springer.com/content/pdf/bfm%3A978-0-387-78747-3%2F1.pdf] or the chapter on DIC in Optical Methods for Solid Mechanics by Pramod Rastogi and Erwin Hack [http://eu.wiley.com/WileyCDA/WileyTitle/productCd-3527411119.html].

For some applications see the special issue on DIC of the Journal of Strain Analysis for Engineering Design [http://sdj.sagepub.com/content/43/8.toc].

Risky predictions

flood

Risk is a much mis-understood word.  In a technical sense, it is the probability of something happening multiplied by the consequences when it does [see post on Risk Definition, September 20th, 2012].  Tight regulation and good engineering could reduce the probability of earthquakes induced by fracking and such earthquakes tend not to produce structural damage, i.e. low consequences, so perhaps it is reasonable to conclude that the risks are low because two small quantities multiplied together do not produce a big quantity [see last week’s post on ‘Fracking’, 28th August, 2013].

The more common definition of risk is the probability of a loss, injury or damage occurring, i.e. severity is ignored.  Probability is used to describe the frequency of occurence of an event.  A classic example is tossing a fair coin, which will come down heads 50% of the time.  This is a simple game of chance that can be played repeatedly to establish the frequency of the event.  It is impractical to use this approach to establish the probability of fracking causing an earthquake, so instead engineers and scientists must simulate the event using computer models.  One approach to simulation is to generate a set of models, each based on slightly different set of realistic conditions and assumptions, and look at what percentage of the models predict earthquakes, which can be equated to the probability of a fracking-induced earthquake.  When the set of conditions is generated randomly, this approach is known as Monte Carlo simulation.  Weather forecasters use simulations of this type to predict the probability of rain or sunshine tomorrow.

The reliability of a simulation depends on the model adequately describing the physical world.  We can test this (known as validating the model) by comparing predicted outcomes with real-world outcomes [see post on 18th September, 2012 on ‘model validation’].  The quality of the comparison can be expressed as a level of confidence usually as a percentage.  Crudely speaking, this percentage can be equated to the frequency with which the model will correctly predict an event, i.e. the probability that the model is reliable, so if we are 90% confident then we would expect the model to correctly predict an event 9 out of 10 times. In other words, there would be a 10% ‘risk’ that the model could wrong.

In practice we cannot easily calculate the probability of a fracking-induced earthquake because it is such a complex process. Validating a model of fracking is also a challenge because of the lack of real examples so that establishing confidence is difficult.  As a consequence, we tend be left weighing unquantified risks in a subjective manner, which is why there is so much debate.

If you made it this far – well done and thank you!   If you want more on weather forecasting and extending these ideas to economic forecasting see  John Kay’s article in the Financial Times on August 14th, 2013 entitled ‘Spotting a banking crisis is not like predicting the weather’ [ http://www.ft.com/cms/s/0/fdd0c5bc-0367-11e3-b871-00144feab7de.html#axzz2dNrTKPDy ].

Model credibility

Last week I spoke at the annual conference of the Associazione Italiana per ‘Analisi dell Sollecitazioni in Vicenza, Italy on the role of experimental mechanics in the validation of computational models used in engineering simulations.  We discussed the conflict between reducing cost and energy consumption and increasing performance and reliability of engineering machines and vehicles.  Generally, the former implies using less material more efficiently, while the latter tends to require the use of more material.  Engineers resolve this conflict by using computational models when optimising designs to simulate engineering behaviour.  The development of elegant and successful designs requires a high level of credibility in the models.  This credibility can be established by comparing the results from models with those from specially-conducted experiments; a process that is known as ‘validation’.