Tag Archives: MyResearch

256 shades of grey

bonnet panelEngineers are increasingly using digital photographs with 256 shades of grey to measure displacement of structural components.  The technique is known as Digital Image Correlation and is the most common way to measure the deformation of engineering structures and components in a laboratory, and increasingly in the field.  DIC provides maps of the displacement of the component surface from which the strain field can be calculated and which in turn allows engineers to assess the behaviour and likely failure modes of the component.  DIC is beginning to revolutionise the way in which we validate computational mechanics models.

DIC involves capturing ‘before’ and ‘after’ images of the component surface while load is applied.  If the surface has a random pattern, which is often created by spray-painting black speckles onto a white background, then it is possible to track the movement of the pattern as the surface moves and deforms.  The images are usually recorded as intensity maps defined by 256 shades of grey or grey levels from white through to black.  A mathematical signature is assigned to facets or sub-images of the intensity map in the ‘before’ image and a correlation algorithm uses the signature to recognise the facet in the ‘after’ image.  The positions of the centre of the facet in the ‘before’ and ‘after’ images indicates the displacement of the corresponding area of the component surface.  Two cameras can be used to provide stereoscopic vision and information on displacements in all directions.

The picture shows a car bonnet or hood panel in a test frame in a laboratory prior to an impact test with a random speckle pattern on the surface to allow DIC to be performed using high-speed cameras. For more details see: Burguete et al , 2013, J. Strain Analysis, doi:10.1177/0309324713498074 at http://sdj.sagepub.com/content/early/2013/09/19/0309324713498074.full.pdf+html

For detailed explanations of DIC try the monograph by Professor Mike Sutton and his colleagues [link.springer.com/content/pdf/bfm%3A978-0-387-78747-3%2F1.pdf] or the chapter on DIC in Optical Methods for Solid Mechanics by Pramod Rastogi and Erwin Hack [http://eu.wiley.com/WileyCDA/WileyTitle/productCd-3527411119.html].

For some applications see the special issue on DIC of the Journal of Strain Analysis for Engineering Design [http://sdj.sagepub.com/content/43/8.toc].
Toxic nanoparticles?

My obsession with kinematics and kinetics over the past few posts is connected to my recent trip to Italy [see my post last week] as part of a research project on the mechanics of nanoparticles.  We are interested in the toxicological effect of nanoparticles on biological cells.  Nanoparticles are finding lots of applications but we don’t completely understand their interaction with cells and organs in the body.  We are interested in particles with diameters around 10 nanometres.  The diameter of a human hair is 10,000 times bigger.  The small size of these particles has potential implications for their kinematics and kinetics as they move through the body.  We know that protein molecules can attach themselves to nanoparticles forming a corona and as part of our research we are looking at how that influences the motion of the particle.  For instance, it might be appropriate to use kinematics for a spherical metallic nanoparticle but kinetics for one with a corona.

Some of you might be thinking, why go to Italy?  Well, other than for the coffee, I have been working with a colleague there for some time on methods of tracking nanoparticles that are below the resolution of optical microscopes.  We have named the technique ‘nanoscopy’ and it allows us to look at live cells and nanoparticles simultaneously without damaging the cell.  So our current research is an extension of the earlier work (see the two papers referenced below).  Of course the more basic answer is that we get on and are very productive together.

BTW – we can’t ‘see’ our nanoparticles because visible light has wavelengths about fifty times larger than the particles, so light waves pass single particles without being reflected into our eyes or camera.  However, a particle does disturb the light wave and produce a weak optical signature, which we utilise in nanoscopy.

Research papers available on-line at:

http://onlinelibrary.wiley.com/doi/10.1002/smll.200800703/abstract

http://onlinelibrary.wiley.com/doi/10.1111/j.1365-2818.2011.03491.x/abstract

Risky predictions

flood

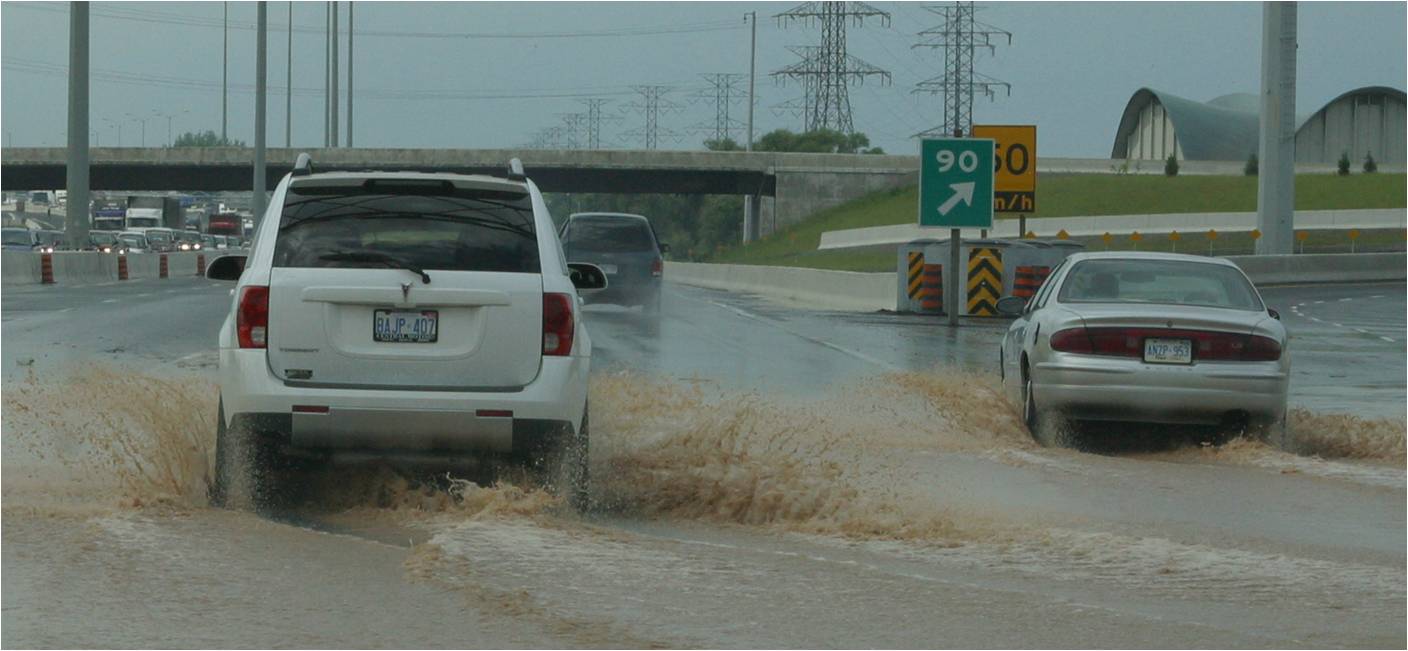
Risk is a much mis-understood word.  In a technical sense, it is the probability of something happening multiplied by the consequences when it does [see post on Risk Definition, September 20th, 2012].  Tight regulation and good engineering could reduce the probability of earthquakes induced by fracking and such earthquakes tend not to produce structural damage, i.e. low consequences, so perhaps it is reasonable to conclude that the risks are low because two small quantities multiplied together do not produce a big quantity [see last week’s post on ‘Fracking’, 28th August, 2013].

The more common definition of risk is the probability of a loss, injury or damage occurring, i.e. severity is ignored.  Probability is used to describe the frequency of occurence of an event.  A classic example is tossing a fair coin, which will come down heads 50% of the time.  This is a simple game of chance that can be played repeatedly to establish the frequency of the event.  It is impractical to use this approach to establish the probability of fracking causing an earthquake, so instead engineers and scientists must simulate the event using computer models.  One approach to simulation is to generate a set of models, each based on slightly different set of realistic conditions and assumptions, and look at what percentage of the models predict earthquakes, which can be equated to the probability of a fracking-induced earthquake.  When the set of conditions is generated randomly, this approach is known as Monte Carlo simulation.  Weather forecasters use simulations of this type to predict the probability of rain or sunshine tomorrow.

The reliability of a simulation depends on the model adequately describing the physical world.  We can test this (known as validating the model) by comparing predicted outcomes with real-world outcomes [see post on 18th September, 2012 on ‘model validation’].  The quality of the comparison can be expressed as a level of confidence usually as a percentage.  Crudely speaking, this percentage can be equated to the frequency with which the model will correctly predict an event, i.e. the probability that the model is reliable, so if we are 90% confident then we would expect the model to correctly predict an event 9 out of 10 times. In other words, there would be a 10% ‘risk’ that the model could wrong.

In practice we cannot easily calculate the probability of a fracking-induced earthquake because it is such a complex process. Validating a model of fracking is also a challenge because of the lack of real examples so that establishing confidence is difficult.  As a consequence, we tend be left weighing unquantified risks in a subjective manner, which is why there is so much debate.

If you made it this far – well done and thank you!   If you want more on weather forecasting and extending these ideas to economic forecasting see  John Kay’s article in the Financial Times on August 14th, 2013 entitled ‘Spotting a banking crisis is not like predicting the weather’ [ http://www.ft.com/cms/s/0/fdd0c5bc-0367-11e3-b871-00144feab7de.html#axzz2dNrTKPDy ].

Hot stuff

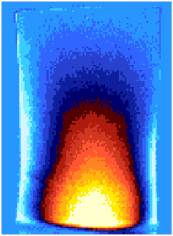
Amplitude of temperature fluctuations in a turbine blade from a jet engine during a vibration test at 700Hz

There have been no postings for a while because I have been away.  Last week I organised a workshop in Glasgow for engineers in industry and academic on [how we can make] ‘Strain Measurements in Extreme Environments’.  Although this included making measurements on large and fast engineering components, half of the workshop was focussed on evaluating strain at high temperatures, 1000°C to 2000°C, which is hot by most standards.  This is beyond the operating range of most sensors and most materials that remain solid at these temperatures glow, which makes optical measurements challenging.

So why are we interested?  For hypersonic flight including applications such as delivering satellites into orbit.  And, because engines become more efficient when operating at high temperatures.

Can we do it? Not in the real-world but in a laboratory environment some research groups have been successfully using digital image correlation with ceramic particles creating a textured pattern on the hot surface that can be tracked as the hot stuff deforms.