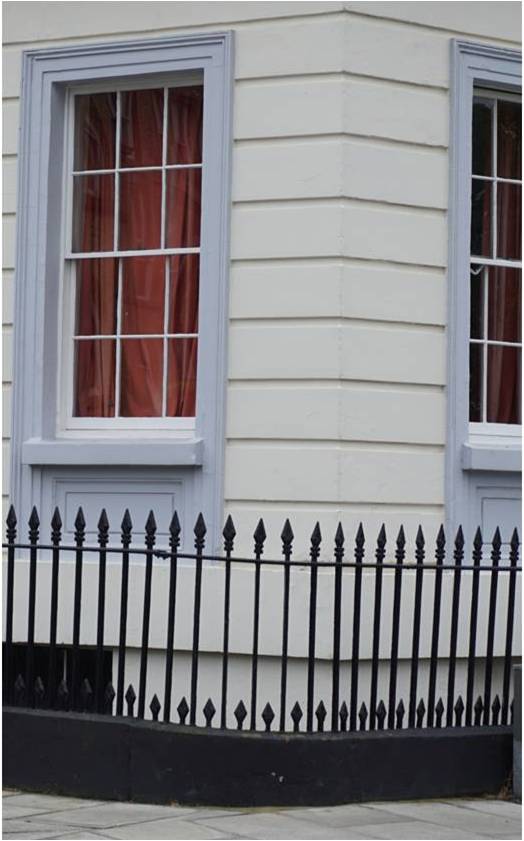
 Regular readers of this blog will know that I spent a relaxing day painting railings a few weeks ago [see post entitled ‘Engineering archaeology‘ on July 23rd, 2014]. A day or so later, I went out with my pail of whitewash to paint the walls of the light-well that the railings protect. ‘The summer world was bright and fresh, and brimming with life’ but unlike Tom Sawyer I was not looking for Jim to do my white-washing for me. I was looking forward to another therapeutic session painting the walls at the front of our house. It was an interesting standing in the light-well facing the wall, un-noticed by most passers-by. We live on a city street close to tourist attractions and there is a constant stream of coaches and taxis stopping to drop-off and pick-up tourists. I have written about the noise insulation in our house before [see Noise Transfer on April 13th, 2013] which means that we don’t notice the constant growl of diesel engines outside but I did while I was painting. However, there were other sounds in the city. The voices of pedestrians deep in conversation as they passed by on the pavement just above my head. I recognised Chinese, French, Italian and English but there were many different languages that I didn’t recognise. There were young children asking parents questions as they walked down the street. For a while I could hear cathedral bells. When there was a pause in the traffic then it was possible to hear the cooing of pigeons, a neighbour’s radio or television and an ever-present idling diesel engine which I discovered was an ice-cream van dispensing a constant trickle of black soot and an occasional ice-cream. It is curious that as a society we tolerant high levels of noise pollution at tourist attractions, especially ones that are meant to be places of calm and contemplation. Most tourists are, almost by definition, on holiday seeking relaxation and a lowering of stress levels – how much more pleasant would it be to glide to your destination in a silent electric coach or taxi?
We have the technology to provide such a service [see Are electric cars back? on May 28th, 2014]. Yes, it requires some investment by tour operators and taxi firms in hybrid or electric vehicles and by the city council in re-charging facilities. Induction charging stations at tourist attractions would allow vehicles to recharge while dropping off and picking up passengers. The technology is available and has been used by buses in Genoa and Turin for more than a decade. So a little bit a regulatory pressure and investment from city councils acting together could create a calmer, quieter and cleaner environment for everyone.
Can we look forward to solar-powered ice-cream vans?
Sources: Thank you to Richard for reminding me about Tom Sawyer.


