Tag Archives: Engineering

Thermodynamic Whoopee

man without a countryThe success of our students in the MyCopter project inspired me a couple of weeks ago to write about the prospect for flying cars [see post on October 2nd, 2014 entitled ‘Origami car-planes‘], which are not good essentially because we don’t know how to manipulate gravity. Everything in the universe is controlled by four forces, i.e. electromagnetic, gravitational, weak nuclear and strong nuclear. Adam Frank, described our understanding and control of electromagnetic forces as god-like because we can manipulate photons, electrons and atoms with enormous precision in flat screen TVs, mobile phones, microwave ovens and much more.

Strong nuclear forces hold protons and neutrons together in the nucleus of atoms and weak nuclear forces control the fusion process in stars. We have managed to take a few tottering steps to control nuclear forces in nuclear power stations but we are blundering apprentices compared to our skills with electromagnetism. However, with gravitational forces we are like toddlers trying to feed ourselves – we have some idea about what we are supposed to be doing but we waste an enormous amount in trying to hit the target. So we use our expertise in electromagnetism to combust fuel in an engine which drives an aerofoil through air faster enough to generate lift. This usually involves burning vast amount of fossil fuel and it gets worse when you want to hover with rotating blades or a vertical jet. Kurt Vonnegut in a ‘A Man without a Country‘ has described our reckless use of fossil fuel as making ‘thermodynamic whoopee’ but if we want fly long distances with significant payloads we don’t have much choice at the moment.

If physicists could work out how to manipulate gravitational forces it would not take engineers long to design and build flying cars that would be as advanced relative to today’s private jet as your tablet computer is relative to an abaqus.

Source:

I was promised flying cars‘ by Adam Frank in the New York Times on June 6th, 2014

Mass produced nuclear power plants?

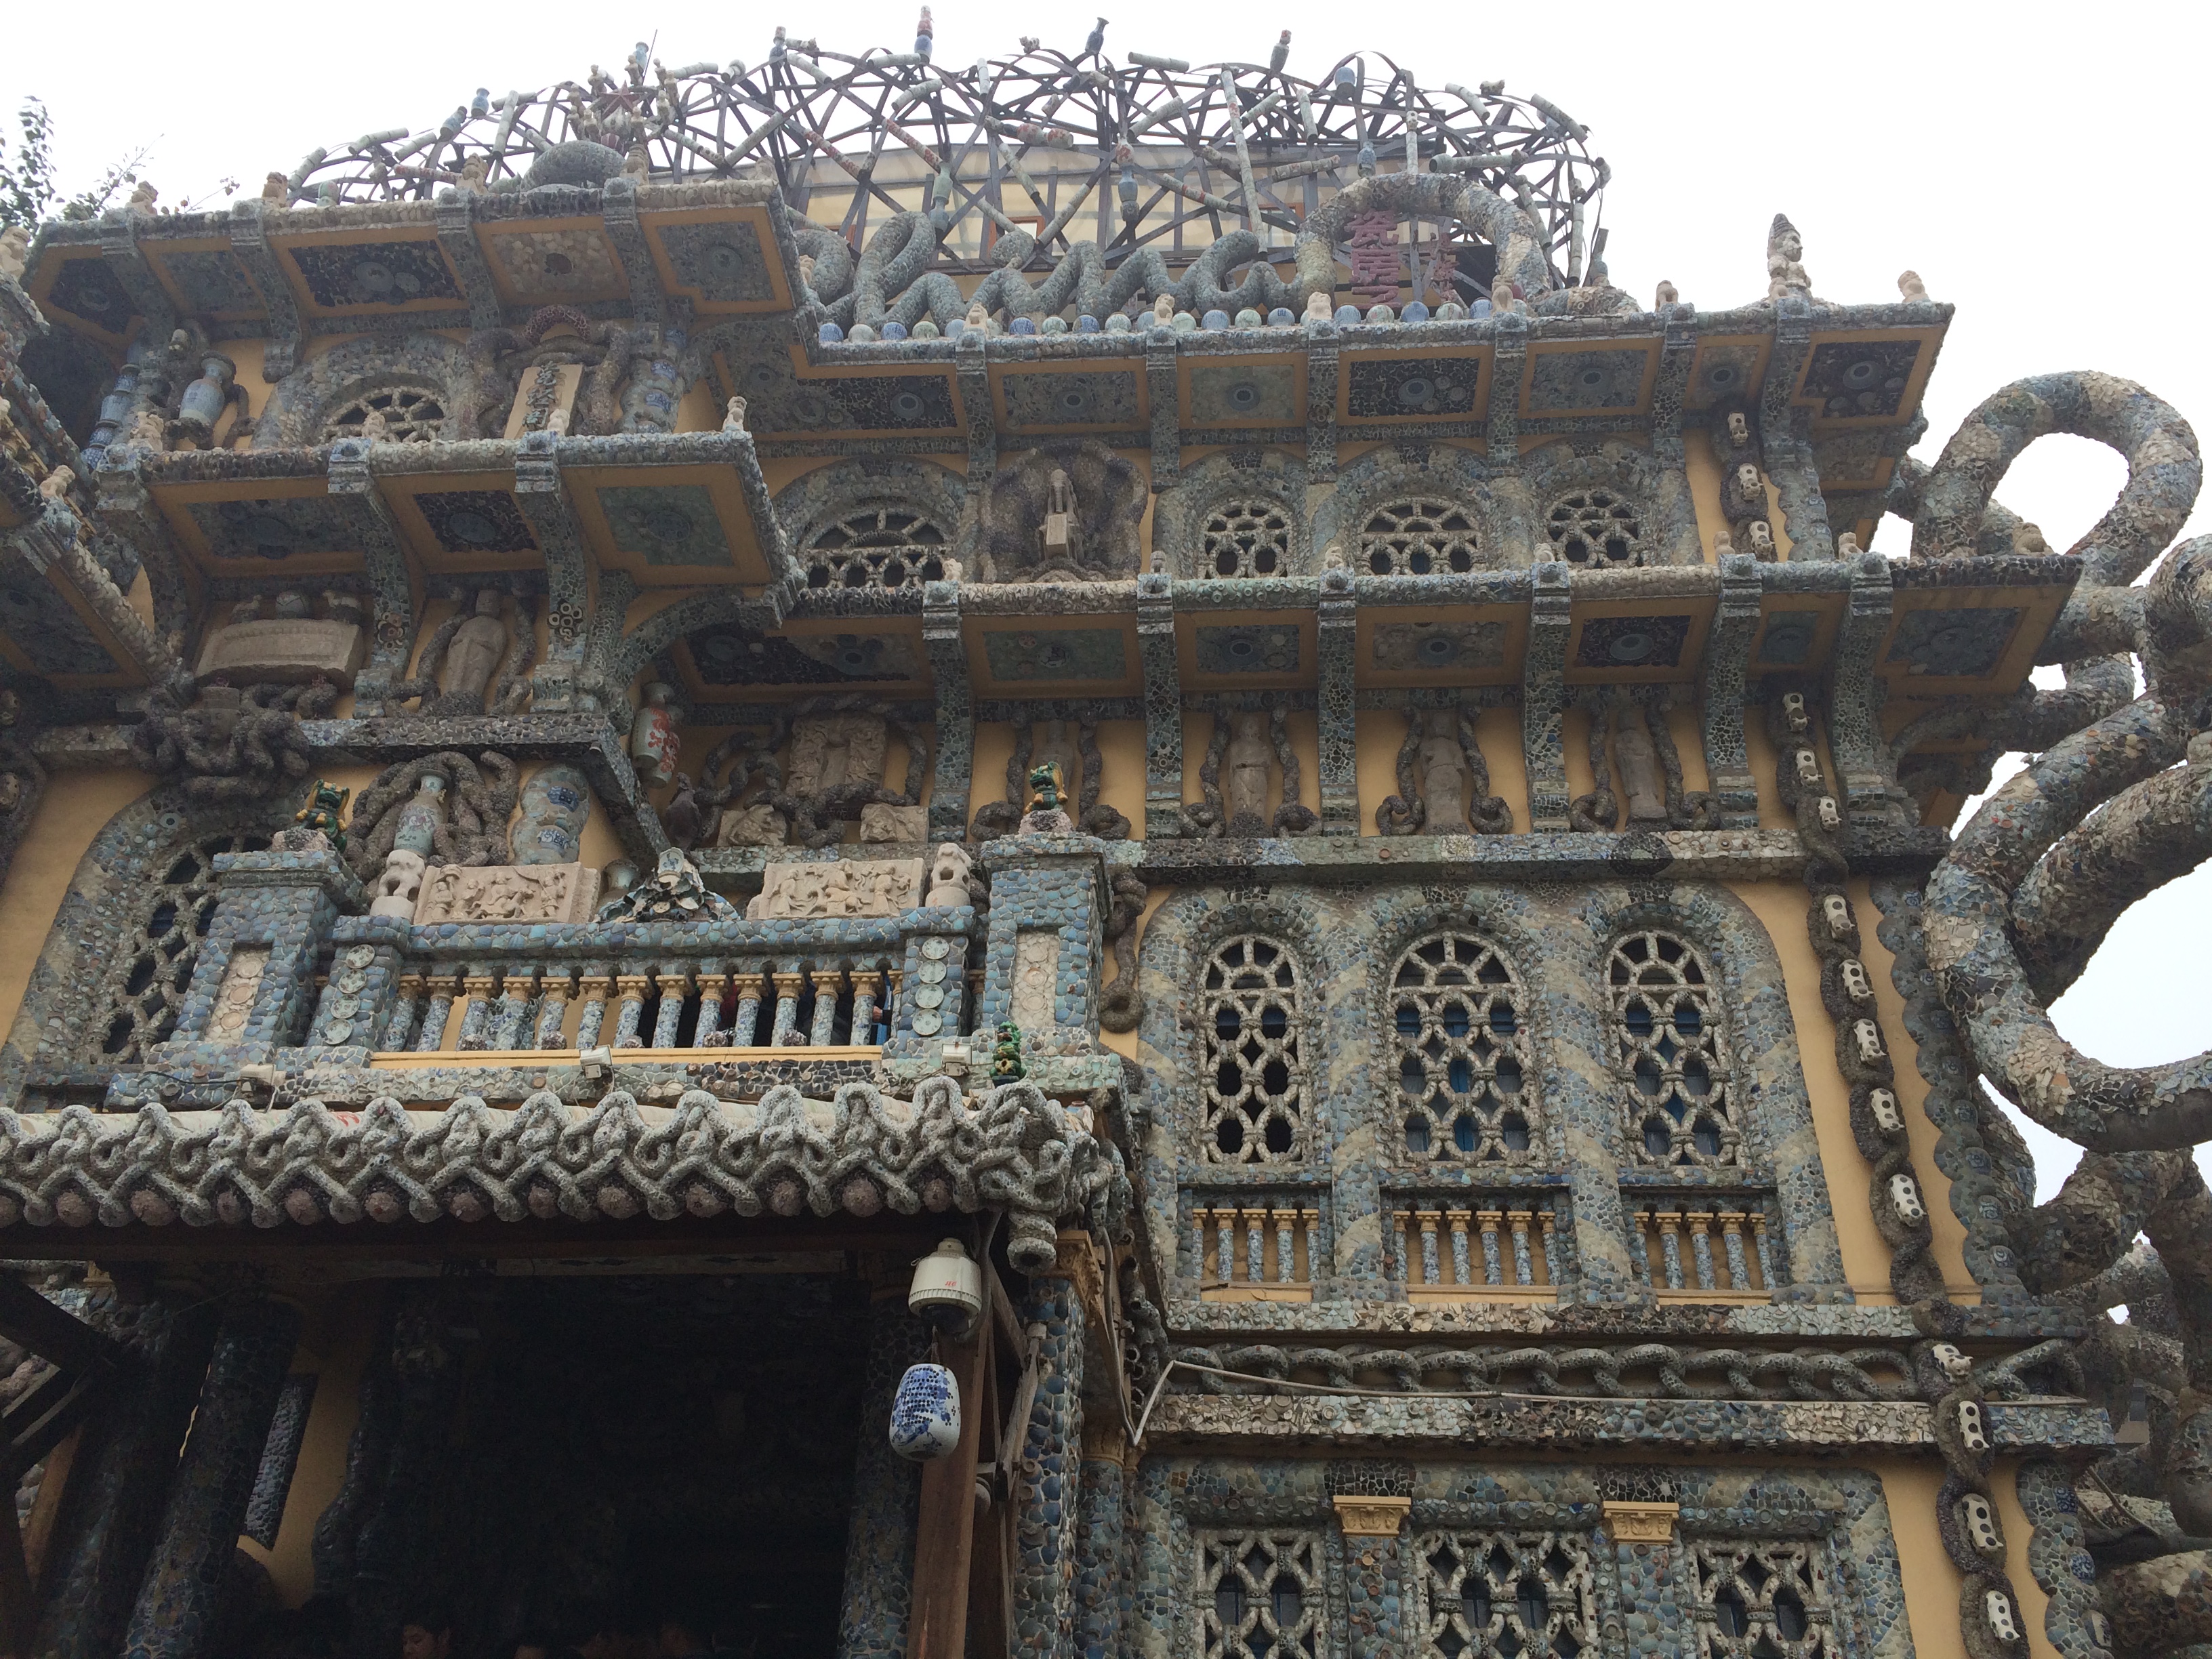
A slightly weird picture of the rather unusual House of Porcelain in Tianjin, which is slowly turning black in the smog.

Porcelain House in Tianjin, which is slowly turning black in the smog.

In the pocket of my coat I have a peculiar souvenir of my recent visit to China. It’s a white face-mask with a little filter built-in to one side. It cost 2 Yuan, or about £0.2, and was given to me by a research student in Tianjin, who worked in my lab in Liverpool for a year. She bought it for me one Saturday when we were going out sightseeing in Tianjin because the air quality was so poor it caught on the back of your throat. The smog was so thick you could not see the tops of even modestly tall buildings.

This is a daily reality for millions of people in many of China’s cities. I reported in my blog entitled ‘Year of the Air: 2013’ [November 20th, 2013] about the number of deaths from pollution.  PM2.5 that’s particles with a diameter less than 2.5 microns are damaging to human health. While I was in Beijing the level of PM2.5 was 144 micrograms per cubic metre, compared to 13 at home in Liverpool.  My student’s mother had visited her while she was in Liverpool and I asked what she liked most during her visit – the fresh air was her reply.

I can’t really remember smog in England though I do remember buildings in the city centres being gradually cleaned because the smog had turned them black. And I remember shortly after I finished my PhD, being shown by a collaborator in the Pathology Department, the lungs from a recent post-mortem – they were grey-black from the smog!

The scale of the problem is difficult to grasp. Tianjin is a provincial city about 30 minutes by bullet train south-east of Beijing with a population of 14 million people, almost twice that of London, and 2.4 million cars.  The smog is generated by pollution from factories, power-stations and cars.  Hybrid cars could make a difference but there are none because they are too expensive, a Beijing colleague told me as he drove me in his brand new Volkswagen Passat. Plug-in cars would not solve the problem because the electricity would come mainly from coal-fired power stations, so the pollution would be simply moved elsewhere.

China needs clean energy, fast and lots of it.  In 2011 China’s installed electricity generating capacity was  about 1TW (Tera Watts or 1 with 12 noughts after it), of which about 2% comes from China’s 21 operating nuclear power plants.  Typical modern nuclear power plants take years to build and generate around 1,000 MW; perhaps we should be considering the small-scale mass production of medium-size modular power plants.  Huge, complex, reliable aeroplanes are made in this way, for instance the current Airbus A380 is production rate is about 25 per year.  So why not medium-size nuclear power plants?  Mass-production would also make decommissioning cheaper since it not be a bespoke process for each plant.

Maybe now that the Lockheed Martin’s Skunk Works have turned their attention to developing a fusion reactor, power-stations will be produced like airliners before I retire.

Sources:

Porcelain House, Tianjin

http://blogs.wsj.com/chinarealtime/2014/10/27/desperate-measures-as-world-leaders-visit-beijing-tries-to-reduce-pollution-by-40/

http://aqicn.org/city/united-kingdom/liverpool-speke/

BTW – My pathology colleague and I were interested in whether people with osteoporosis could break their hips and fall, rather than the usual assumption of falling and break their hips. See:

Wilkinson JM, Cotton DWK, Harris SC & Patterson EA, Assessment of osteoporosis at autopsy: mechanical methods compared to radiological and histological techniques, Medicine, Science & the Law, 31(1):19-24, 1991.

Cotton DWK, Whitehead CL, Vyas S, Cooper C & Patterson EA, Are hip fractures caused by falling and breaking or breaking and falling? Forensic Science Int., 65(2):105-112, 1994.


Holes in fluids

Out-of-focus image from optical microscope of 10 micron diameter polystrene spheres in water

Out-of-focus image from optical microscope of 10 micron diameter polystyrene spheres in water

The holes that I wrote about last week and the week before (post entitled ‘Holes‘ on October 8th)were essentially air-filled holes in a solid plate.  When an in-plane load is applied to the plate it deforms and its surface around the hole becomes curved due to the concentration of stress and light passing through the curved surfaces is deviated to form the caustic.  If you didn’t follow that quick recap on last week then you might want flip back to last week’s post before pressing on!

The reverse situation is a solid in a fluid.  It is difficult to induce stress in a fluid so instead we can use a three-dimensional hole, i.e. a sphere, to generate the curve surface for light to pass through and be deviated.  This is quite an easy experiment to do in an optical microscope with some polystyrene spheres floating in distilled water with the microscope slightly out of focus you get bright caustics.  And if you take a series of photographs (the x-y plane) with the microscope objective lens at different heights (z-value) it is possible to reconstruct the three-dimensional shape of the caustic by taking the intensity or greyscale values along the centre line of each image and using them all to create new image of the x-z and, or y-z plane, as shown in the picture.

Well done if you have got this far and are still with me!  I hope you can at least enjoy the pictures.  By the way the particle in the images is about the same diameter as a human hair.

Image in optical microscope of polystrene particle in water (left), series of images at different positions of microscope objective (centre) and artificial image created from greyscale data along centre-lines of image series (right).

Image in optical microscope of polystyrene particle in water (left), series of images at different positions of microscope objective (centre) and artificial image created from greyscale data along centre-lines of image series (right).

Source:

Patterson, E.A., & Whelan, M.P., Tracking nanoparticles in an optical microscope using caustics, Nanotechnology, 19(10): 105502, 2008.

Caustics

caustic_hole

White light caustic of 4mm diameter hole in 6mm (PMMA) plate subject to 3kN tension

As children many of us have burnt a hole (yes, tenuous link to last week’s post on ‘Holes’) in a piece of paper by focussing the sun’s rays with a magnifying glass. If you move the glass up or down and tilt it slightly then the sun’s rays will not be focussed on a spot and instead you see a complex spiralling pattern of light. This pattern is caused by the rays being bent by their passage through different sections of the curved glass. The same type of pattern, known as a caustic, appears on the bottom of your bath when you let (clean) water run out down the plug-hole if you have spotlights above the bath. This caustic is produced by the light rays from the spotlight being bent by varying degrees depending on where they pass through the vortex formed by the water spinning down the hole.  Caustics can also be produced when light passes through a glass of water or on the bottom of an outdoor swimming pool in bright sunlight.

The top picture shows the caustic formed by light passing through a transparent plate with a hole when the plate is stretched in the vertical direction. The load in the plate has to flow around the hole where it ‘bunches up’ or concentrates (see last week’s post entitled ‘Holes’) which causes high levels of local deformation with the plate thinning non-linearly at the intersection of the hole circumference and horizontal diameter. When the light passes through the deformed region it is deviated by amount dependent on the local thinning and forms the pattern shown.

This is not a totally abstract phenomenon because the same mechanism of thinning occurs at the tip of cracks as a result of the very high stress concentration at the sharp crack tip, as shown schematically in the diagram below. So we can evaluate the stress concentration by measuring the caustic it generates; it is even possible to predict in which direction the crack will grow next.

Schematic diagram of transparent plate with a crack loaded vertically in tension (left), light ray tracings through the cracked region (centre) and caustic formed on a screen (right).

Schematic diagram of transparent plate with a crack loaded vertically in tension (left), light ray tracings through the cracked region (centre) and caustic formed on a screen (right).

For information:

Carazo-Alvarez, J.D., Patterson, E.A., 1999, ‘A general method for automated analysis of caustics’, Optics & Lasers in Engng., 32: 95-110.

http://lgg.epfl.ch/caustics/