Category Archives: Thermodynamics

Ample sufficiency of solar energy?

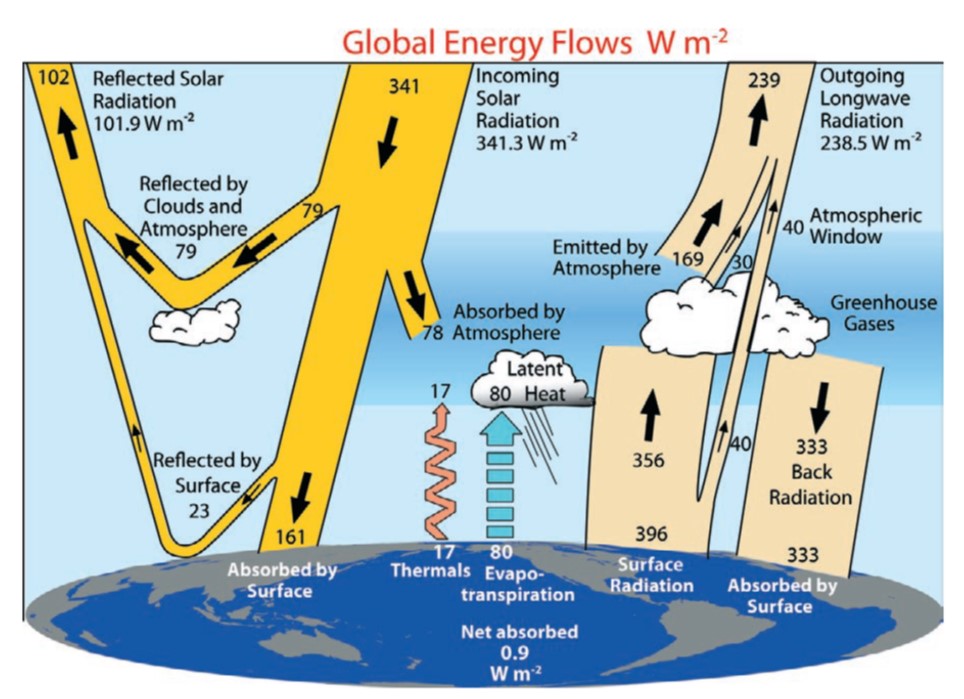
Global energy budget from Trenberth et al 2009

I have written several times about whether or not the Earth is a closed system [see for example: ‘Is Earth a closed system? Does it matter‘ on December 10th, 2014] & ‘Revisiting closed systems in Nature‘ on October 5th, 2016).  The Earth is not a closed thermodynamic system because there is energy transfer between the Earth and its surroundings as illustrated by the schematic diagram. Although, the total incoming solar radiation (341 Watts/sq. metre (W/m²)) is balanced by the sum of the reflected solar radiation (102 W/m²) and the outgoing longwave radiation (239 W/m²); so, there appears to be no net inflow or outflow of energy.  To put these values into perspective, the world energy use per capita in 2014 was 1919 kilograms oil equivalent, or 2550 Watts (according to World Bank data); hence, in crude terms we each require 16 m² of the Earth’s surface to generate our energy needs from the solar energy reaching the ground (161 W/m²), assuming that we have 100% efficient solar cells available. That’s a big assumption because the best efficiencies achieved in research labs are around 48% and for production solar cells it’s about 26%.

There are 7.6 billion of us, so at 16 m² each, we need  120,000 square kilometres of 100% efficient solar cells – that’s about the land area of Greece, or about 500,000 square kilometres with current solar cells, which is equivalent to the land area of Spain.  I picked these countries because, compared to Liverpool, the sun always shines there; but of course it doesn’t, and we would need more than this half million square kilometres of solar cells distributed around the world to allow the hours of darkness and cloudy days.

At the moment, China has the most generating capacity from photovoltaic (PV) cells at 78.07 GigaWatts or about 25% of global PV capacity and Germany is leading in terms of per capita generating capacity at 511 Watts per capita, or 7% of their electricity demand.  Photovoltaic cells have their own ecological footprint in terms of the energy and material required for their production but this is considerably lower than most of our current sources of energy [see, for example Emissions from photovoltaic life cycles by Fthenakis et al, 2008].

Sources:

Trenberth KE, Fasullo JT & Kiehl J, Earth’s global energy budget, Bulletin of  the American Meteorological Society, March 2009, 311-324, https://doi.org/10.1175/2008BAMS2634.1.

World Bank Databank: https://data.worldbank.org/indicator/EG.USE.PCAP.KG.OE

Nield D, Scientists have broken the efficiency record for mass-produced solar panels, Science Alert, 24th March 2017.

2016 Snapshot of Global Photovoltaic Markets, International Energy Agency Report IEA PVPS T1-31:2017.

Fthenakis VM, Kim HC & Alsema E, Emissions from photovoltaic life cycles, Environmental Science Technology, 42:2168-2174, 2008.

Red to blue

Some research has a very long incubation time.  Last month, we published a short paper that describes the initial results of research that started just after I arrived in Liverpool in 2011.  There are various reasons for our slow progress, including our caution about the validity of the original idea and the challenges of working across discipline boundaries.  However, we were induced to rush to publication by the realization that others were catching up with us [see blog post and conference paper].  Our title does not give much away: ‘Characterisation of metal fatigue by optical second harmonic generation‘.

Second harmonic generation or frequency doubling occurs when photons interact with a non-linear material and are combined to produce new photons with twice the energy, and hence, twice the frequency and half the wavelength of the original photons.  Photons are discrete packets of energy that, in our case, are supplied in pulses of 2 picoseconds from a laser operating at a wavelength of 800 nanometres (nm).  The photons strike the surface, are reflected, and then collected in a spectrograph to allow us to evaluate the wavelength of the reflected photons.  We look for ones at 400 nm, i.e. a shift from red to blue.

The key finding of our research is that the second harmonic generation from material in the plastic zone ahead of a propagating fatigue crack is different to virgin material that has experienced no plastic deformation.  This is significant because the shape and size of the crack tip plastic zone determines the rate and direction of crack propagation; so, information about the plastic zone can be used to predict the life of a component.  At first sight, this capability appears similar to thermoelastic stress analysis that I have described in Instructive Update on October 4th, 2017; however, the significant potential advantage of second harmonic generation is that the component does not have to be subject to a cyclic load during the measurement, which implies we could study behaviour during a load cycle as well as conduct forensic investigations.  We have some work to do to realise this potential including developing an instrument for routine measurements in an engineering laboratory, rather than an optics lab.

Last week, I promised weekly links to posts on relevant Thermodynamics topics for students following my undergraduate module; so here are three: ‘Emergent properties‘, ‘Problem-solving in Thermodynamics‘, and ‘Running away from tigers‘.


Ramblings on equality

By David Samuel, User:Hellodavey1902 – Own work, CC BY-SA 3.0,

I had some time to spare in Oxford last week and visited the Treasury in the Weston Library again (see my post entitled ‘The Red Crane‘ on July 26th, 2017).  I was amazed to be confronted by an eight-hundred year-old copy of the Magna Carta.  No fuss, no fanfare, just sitting there behind a glass screen as close as you are to your screen as you read this blog.  But the Bodleian Library has four copies of the Magna Carta; so, maybe it’s nothing special to them!  This one is slightly dogged-eared, or to be more precise, rodent-nibbled – there were a couple of small holes where an animal had gnawed it while it was folded up and stored at Osney Abbey from its issue following King John’s death in 1217 until the Abbey’s dissolution in 1539.  The equivalent documents in the USA, the declaration of independence, the constitution and the bill of rights, are housed in the grandiose building on the National Mall, shown in the picture.

After the Weston Library Treasury, I went to the bookshop next door and could not resist buying a couple of books: ‘Signs Preceding the End of the World‘ by Yuri Herrara and ‘The Wandering Falcon‘ by Jamil Ahmad.  Hopefully, I will not succumb to tsundoku (see my post on ‘Tsundoku‘ on May 24th, 2017) and will eventually read these novels.  BTW – you can read the Magna Carta here.

It’s October and the start of university term, which also means that once again I am teaching thermodynamics to first-year undergraduate students. I have blogged on thermodynamics frequently; so, I am going to provide links to these posts during the next couple of months.  Primarily for those of my undergraduate students who find their way to this blog, but hopefully these links will also be of interest to regular readers. My opening lecture set thermodynamics in the context of the more familiar sciences as described in my post entitled ‘And then we discovered thermodynamics‘ on February 3rd, 2016.  Last week’s lecture started with the Zeroth Law of Thermodynamics, which I have discussed in two posts entitled ‘All things being equal‘ on December 3rd, 2014 and ‘Lincoln on equality‘ on February 6th, 2013 – now I’ve gone in a full circle, if somewhat shakily!

Steamy show

The Australian Academy of Technology and Engineering published a report sometime ago called ‘Technology is really a way of thinking‘.  They were right.  Once you become an engineer, then you can’t help looking at everything through the same ‘technology’ lens.  Let me give you an example.

A couple of weekends ago we went to see  ‘Anthony and Cleopatra‘ performed by the Royal Shakespeare Company in Stratford-upon-Avon.  It was a magnificient spectacle and a captivating performance, especially by Josette Simon as Cleopatra.  Before the performance started, we couldn’t help noticing the columns of steam forming in the auditorium from the ceiling downwards.  Initially, we thought that they were a stage effect creating an atmosphere in the theatre; but then I realised, it was ‘steam’ forming as the air-conditioning pushed cold air into the auditorium.  It’s the same effect that sometimes causes alarm on an aircraft, when it appears that smoke is billowing into the cabin prior to take-off.

The air in the theatre was a mixture of air and water vapour that was warm enough that the water was completely gaseous, and hence, invisible.  However, when the air-conditioning pumped cold air into the theatre, then the mixture of air and water was cooled to below the dew point of the water vapour causing it to condense into small droplets that were visible in the auditorium’s downlighters, forming the columns of ‘steam’.  Of course, the large mass of warm air in the auditorium quickly reheated the cold air, causing the droplets to evaporate and the columns of steam to disintegrate.  Most people just enjoyed the play; it’s just the technologists that were preoccupied with what caused the phenomenon!

If you want a more technical explanation, in terms of partial pressures and psychrometry, then there is an Everyday Engineering Example lesson plan available : 5E lesson plan T10 – psychrometric applications.

Picture: https://www.rsc.org.uk/shop/item/30200-anthony-and-cleopatra-poster-2017/