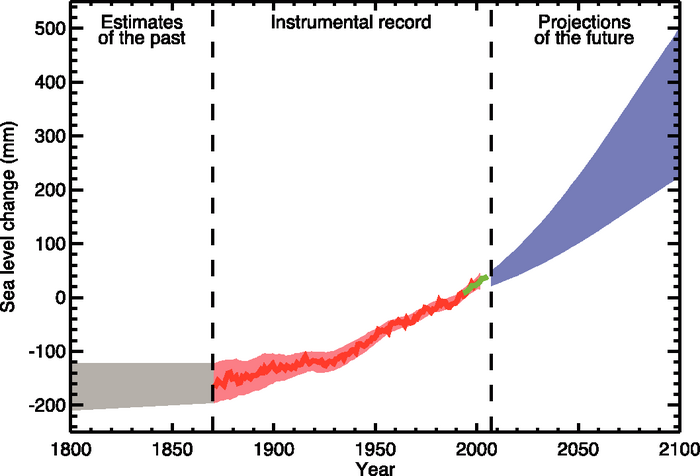
It seems unlikely that global warming will be limited to only 1.5 degrees Centigrade above pre-industrial levels in the light of recent trends in temperature data [see ‘It was hot in June and its getting hotter’ on July 12th, 2023 ]. It is probable global warming will lead to average surface temperatures on the planet rising by 4 or 5 degrees, perhaps within a matter of decades. A global average temperature rise of only 2 degrees would make the Earth as warm as it was 3 million years ago when sea levels were 25 to 35 m (80 to 130 ft) high (Blockstein & Wiegman, 2010). While it is still important to aim for zero carbon emissions in order to limit global warming and avoid global temperatures reaching a tipping point, it seems improbable that politicians worldwide will be able to agree and implement effective actions to achieve the goal in part because of the massive, vested interests in industrialised economies based on fossil fuels [see ‘Are we all free-riders?’ On April 6th, 2016]. Hence, we need to start planning for potentially existential changes in the climate and environment that will force us to adapt the way we live and work. In addition to rises in sea levels, a world that is 4 degrees hotter is likely to have an equatorial belt with high humidity causing heat stress across tropical regions that make them uninhabitable for most of the year. To the north and south of this equatorial belt will be mid-latitude belts of inhospitable deserts extending as far north as a line through Liverpool, Manchester, Hamburg, the straits north of Sapporo in Japan, Prince Rupert in British Columbia and Waskaganish on the Hudson Bay. The habitable zones for humans are likely to be north of this line and in the south in Antarctica, Patagonia, Tasmania and the south island of New Zealand. Agriculture will probably be viable in these polar regions but will compete with a very dense population [see ‘Belts of habitability in a 4° world’ in Nomad Century by Gaia Vince]. In other words, there will likely be mass migrations that will force a re-organisation of society and a restructuring of our economies. Some estimates suggest that there could be as many as 1.2 billion environmental migrants by 2050 (Bellizzi et al, 2023). We need to start adapting now, the world around us is already adapting [see ‘Collaboration and competition’ on June 8th, 2022].
Is it time to change priorities on climate change?
1 Reply