Bridging cultures

cpsnow
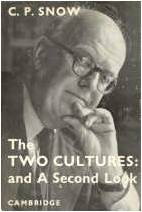
As long ago as 1959, Sir Charles Snow identified two cultures in modern society, which could be summarised as those that understand the consequences of the second law of thermodynamics and those that don’t [see my post entitled Two Cultures on March 5, 2013].

The main aim in writing this blog is to help in bridging the gap between these cultures by commenting on and explaining engineering concepts, ideas and principles in a way that non-engineers can appreciate and might read.  One of the reasons for the gap between the cultures within our society is that ‘technology is really a way of thinking’ [see reference below].  Engineering educators spend a lot of time teaching prospective engineers how to think and, in particular, how to solve engineering problems.  However, these same educators often forget when introducing engineering students  to the principles of engineering for the first time that the students are not familiar with the language or culture.  The students are just starting to cross the gap and their educators, who are on the other side of the gap, fail to appreciate the width of the gap.  The result is that educators fail to engage the students which results in poor recruitment and retention of engineering students.  This failing is recognised by some people, see for instance http://www.engageengineering.org/

One solution to help students cross the gap is to use familiar everyday examples to explain engineering concepts.  I have made a short video about the underlying pedagogy together with some examples that you can find at http://www.youtube.com/watch?v=qAh4QHC8ya0&feature=youtu.be .  There is also a series of booklets [ http://www.engineeringexamples.org/ ] designed to support university teachers who want to teach in this way.  I plan to rewrite the examples in these booklets as periodic posts on this blog for a wider, non-technical audience.  So watch this space!

‘Technology is really a way of thinking’: http://www.atse.org.au/Documents/Publications/Reports/Education/ATSE%20Technology%20Education%20A%20Way%20of%20Thinking%202004.pdf

Impossible perfection

Carnot's equation for ideal efficiency of a cyclic device converting heat to work and operating between two temperatures specified on the Kelvin scale

Carnot’s equation for ideal efficiency of a cyclic device converting heat to work and operating between two temperatures specified on the Kelvin scale

In my last post [National efficiency on 29th May, 2013] I calculated the efficiency of the nationwide process of electricity generation in the UK [35.8%] and made no comment on the relatively low value.  It will be similarly in all industrialised countries as a consequence of the second law of thermodynamics and the requirement for all real processes to increase entropy.  A French engineer / scientist, Sadi Carnot [1796-1832] demonstrated from the second law, that the maximum efficiency achievable in ideal conditions by a process operating in a cycle to convert heat into work is a ratio of the temperatures of the heat source and cold sink to which excess heat is dumped.  In a power station the heat source might be a fossil-fuelled furnace, a nuclear reactor or a solar concentrator.  The cold sink is usually the environment, perhaps in the form of river or sea water.  So both source and sink temperatures are limited.  The sink by the local climate and the source by the temperatures that modern materials can withstand.

The very best efficiency based on Carnot’s expression for a maximum material temperature of 350 degrees Centigrade [=623 Kelvin] and environment temperature of 5 degrees Centigrade [278 Kelvin] is 55%.  Of course a real power station will never operate at this level because ideal conditions are not achievable – perfection is impossible.

The ideal efficiency improves as the operating temperatures of the heat source and sink are moved further apart and this quest to raise this temperature difference drives a substantial proportion of materials research.  However, even operating with a heat source at 800 degrees Centigrade, using expensive, high temperature alloys, such as Hastelloy N  [a nickel-chromium alloy], on a winter day in the Canadian capital, Ottawa where the average January daytime temperature is -7 degrees Centigrade, the Carnot efficiency of a power station would be only 75%  [=1-(266/1073)].

National efficiency

Thermodynamics, especially the first and second laws, are usually perceived as boring and perhaps mysterious by most people, including many engineers, as well as irrelevant by many non-engineers.  However, thermodynamics is fundamental to how engineers deliver products and services to society.  The name ‘thermodynamics’ does not help much, perhaps it would be better to call it ‘energy science’, since it is about energy transfers, conversions and flows.

The national energy flow charts mentioned in my post about ‘Energy Blending’ on 22 May 2013 illustrate nicely the first and second laws of thermodynamics (or energy science).  The underlying basis of the flowcharts is to treat the nation as a system and to account for the energy flows in and out across the system boundaries.  The first law, which is about conservation of energy, demands that the inflow and outflow balance one another, so for the UK and USA the annual inflows were 12.5 and 92 quintrillion joules respectively.  A quadtillion is a million million million or 1 with 18 zeros.

The second law demands that any real process involves an increase in entropy, which is a measure of energy dispersion, essentially lost or wasted energy, and this is also present in the flow charts.  In the centre of the UK chart is electricity generation or conversion with an input totally 82.4 Mtoe [millions tons oil equivalent], an output of 29.5 Mtoe and losses of 48.2 Mtoe, which are demanded by the second law of thermodynamics.  So the overall efficiency of electricity generation in the UK is 35.8% [=desired output/required input].

Footnote: the raw data for the UK and USA energy inflows were 299.2 Mtoe [millions tons oil equivalent] and 97 quadrillion Btu [British Thermal units] respectively which I converted into the SI unit for energy, the joule.  The links for the energy flow charts are:

UK Energy flow chart: http://www.gov.uk/government/uploads/system/uploads/attachment_data/file/65897/5939-energy-flow-chart-2011.pdf

USA Energy flow chart: http://www.eia.gov/totalenergy/data/annual/pdf/aer.pdf

Energy blending

As I write this post, the electricity demand in the UK is 37.5 GW [=37,500,000,000 Watts].  The industry claims that wind turbines typically supply about 30 to 40% of their capacity, while the National Wind Watch in the US claims 15 to 30%.  In other words, a large wind turbine rated at 3MW [3,000,000 Watts] would will typically generate 1MW from its 50m blades that give it a total height of about 130m [about 30% higher than St Paul’s Cathedral in London].  So 37,500 such wind turbines would be required to meet current electricity demand in the UK, or one for every 1.6 miles on a square grid covering the country, which is why blending of energy sources is essential [see posting on May 15th, 2013 on Energy diversity].

We can do similar calculations for solar panels, which typically produce 250 Watts /square metre but for only perhaps 4 hours per day in the UK, so that 150 square kilometres of solar panels would be needed to meet current demand, if the sun was shining which it is not – another reason for blending energy sources.

Fossil fuel fired power stations make up 70% of the blend in the UK and are responsible for about 25% of the UK carbon emissions.  The UK government aims to reduce carbon emissions by 80% by 2050 (based on 1990 levels), so about 65% of the UK powerstations have to be changed in the next 35 years to provide a more sustainable blend of energy sources.  This is not long given the scale of the infrastructure projects required and the situation is the same in many countries around the world.  So there is plenty for engineers to do once the decisions have been made on the blend.

[ http://www.gov.uk/government/uploads/system/uploads/attachment_data/file/65897/5939-energy-flow-chart-2011.pdf ]

[ http://www.gov.uk/government/policies/reducing-the-uk-s-greenhouse-gas-emissions-by-80-by-2050 ]