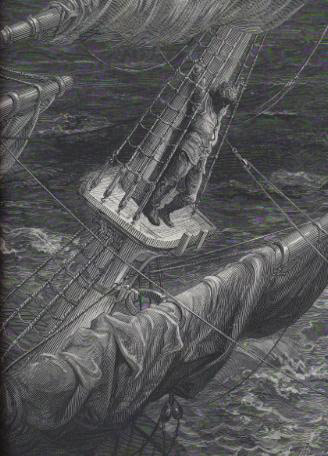
Wood engraving illustration of the Ancient Mariner by Gustave Dore
Water, water, every where,
And all the boards did shrink;
Water, water, every where,
Nor any drop to drink.
These lines are from the Rime of the Ancient Mariner by Samuel Taylor Coleridge published in 1798. They were brought to my mind when I was looking at the data in the GIO report on ‘Water’ that I mentioned in my post entitled ‘Closed system: water’ [17th July, 2013].
The quantity of water used to produce some everyday familiar items is staggering, for instance 140 liters to make one cup of coffee [growing the beans, harvesting, transporting and processing them], or 1,300 litres for a kilogram of wheat resulting in 40 litres per slice of bread but that is tiny compared to 1800 litres for a 4oz beef burger. You might be reading this in a part of the world that is constantly, or at least frequently, deluged with rain and so be thinking that none of this matters, except that much of what you consumes probably comes from a part of the world where water is less readily available and massive civil engineering projects are required to ensure an adequate supply, which have enormous ecological consequences.
And that pair of jeans you are probably wearing, well, they required 10,855 litres of water!